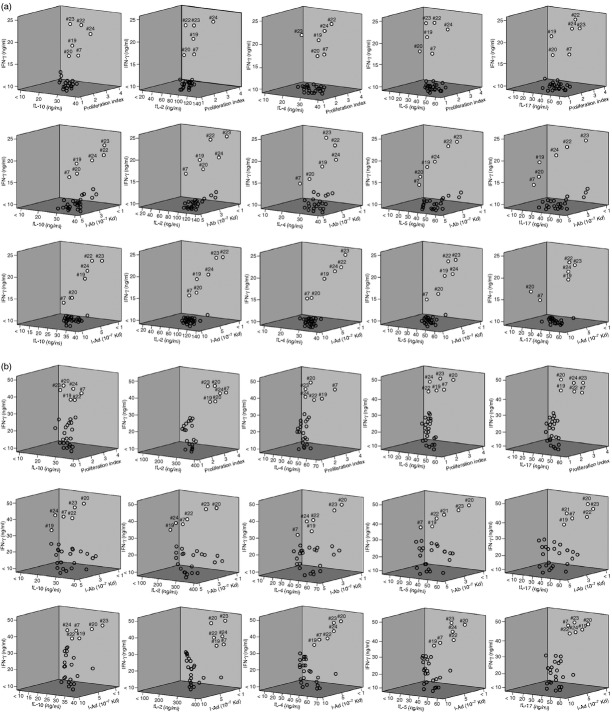
Figure 9.
(a) Three-dimensional plots of T helper type 1 (Th1)/Th2 cytokine secretion relative to proliferation or I-A and I-E predicted peptide-binding by cervical lymph node (CLN)-derived CD4+ T cells. The panels summarize interleukin-2 (IL-2), interferon-γ (IFN-γ), IL-4, IL-5, IL-10 and IL-17, proliferation responses, and predicted I-A binding affinities of pneumococcal surface adhesin A (PsaA) peptide-specific CD4+ T cells isolated from cervical lymph nodes of F1 (B6 × BALB/c) mice, 28 days after Streptococcus pneumoniae strain EF3030 challenge. The y-axis and x-axis indicate the concentration (ng/ml) of cytokine, secreted by PsaA peptide-stimulated CD4+ T cells. The z-axis represents the predicted I-A or I-E binding affinities (Kd). PsaA peptides 7, 19, 20, 22, 23 and 24 appear as white circles, while remaining peptides are open circles. (b) Three-dimensional plots of Th1/Th2 cytokine secretion relative to proliferation or I-A and I-E predicted peptide-binding by spleen-derived CD4+ T cells. The panels summarize IFN-γ, IL-10, IL-2, IL-4, IL-5, IL-17, proliferation responses, and predicted I-A-binding affinities of PsaA peptide-specific CD4+ T cells isolated from spleen of F1 (B6 × BALB/c) mice, 28 days after S. pneumoniae strain EF3030-challenge. The y-axis and x-axis indicate the concentration (ng/ml) of IFN-γ and IL-10, IL-2, IL-4, IL-5 and IL-17, respectively, secreted by PsaA peptide-stimulated CD4+ T cells. The z-axis represents the predicted I-A binding affinities (Kd). PsaA peptides 7, 19, 20, 22, 23 and 24 appear as white circles, while remaining peptides are open circles.

