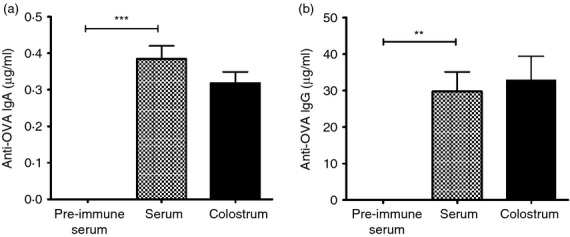
Figure 1.

Anti-ovalbumin (OVA) IgA (a) and IgG (b) concentration in serum and colostrum of immunized sows. Five OVA-seronegative sows were bled and immunized with OVA 4 and 2 weeks before farrowing. Each bar represents the mean of the antibody concentration (μg/ml) in pre-immune serum, serum and colostrum of sows at farrowing ± SEM detected by ELISA. A Student's t-test was used to detect differences in sera, **P < 0·01, ***P < 0·001. Note that graph scales differ.
