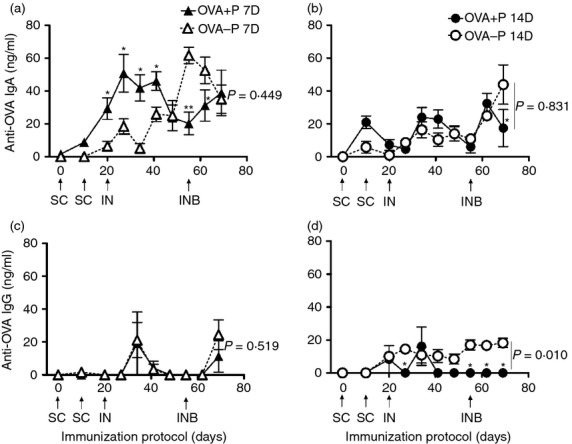
Figure 4.

Anti-ovalbumin (OVA) IgA (a, b) and IgG (c, d) responses in nasal secretions of 7-day-old (7D) or 14-day-old (14D) immunized piglets in the presence (OVA+P) or absence (OVA–P) of anti-OVA maternal antibodies (MatAb). Each triangle or circle represents the mean of the antibody concentration in nasal secretions of five to eight piglets ± SEM, detected by ELISA. Arrows indicate the days and route of immunization. SC = subcutaneous, IN = intranasal, or INB = IN boost. By two-way repeated measures analysis of variance, significant differences were found with time (P < 0·001) for IgA; and among groups (P = 0·013) and with time (P < 0·001) for IgG. Hence, a Student–Newman–Keuls test was used to compare groups of the same age, for each isotype (P shown in the graph) at each time-point (shown by asterisks, *P < 0·05, **P < 0·01). Note that graph scales differ.
