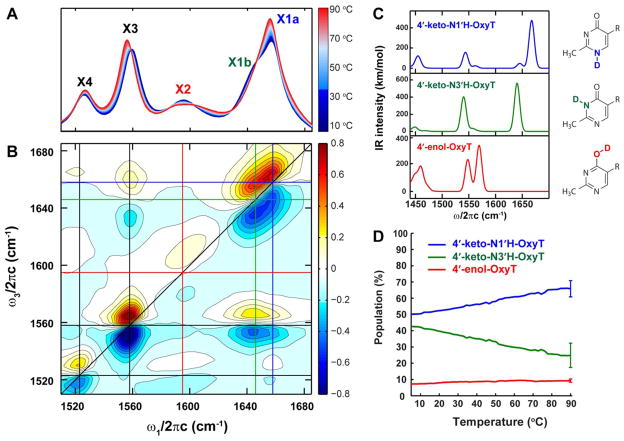
Figure 3.
A. FTIR spectra of OxyT in TPP buffer taken at various temperatures (5 °C – 90 °C); B. 2D IR spectrum of OxyT under the same solvent condition at 10 °C; C. DFT calculated IR spectra for the three OxyT tautomers using QChem. The frequencies have been scaled by 0.9614; D. Temperature dependence of populations of tautomers of OxyT. The populations were obtained from fitting the variable temperature FTIR spectra (Figure S6). Representative error bars are shown at 90 °C and are roughly independent of temperature.

