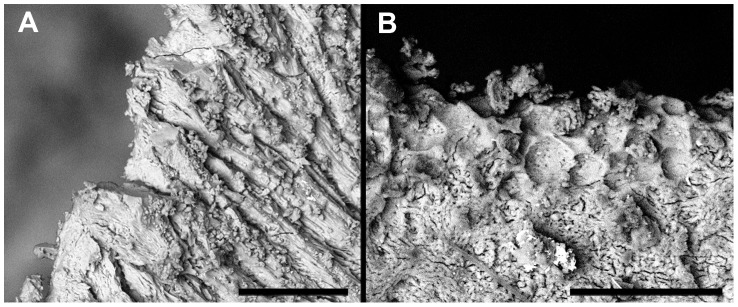
Figure 14. Comparison of SEM-images of taphonomic and pathological lesions.

A) shows the margin of a defect caused by post-mortem damage. B) shows pathological changes on the margin of a lytic lesion in the cortical surface (bar on the bottom of each image indicates 100 µm).
