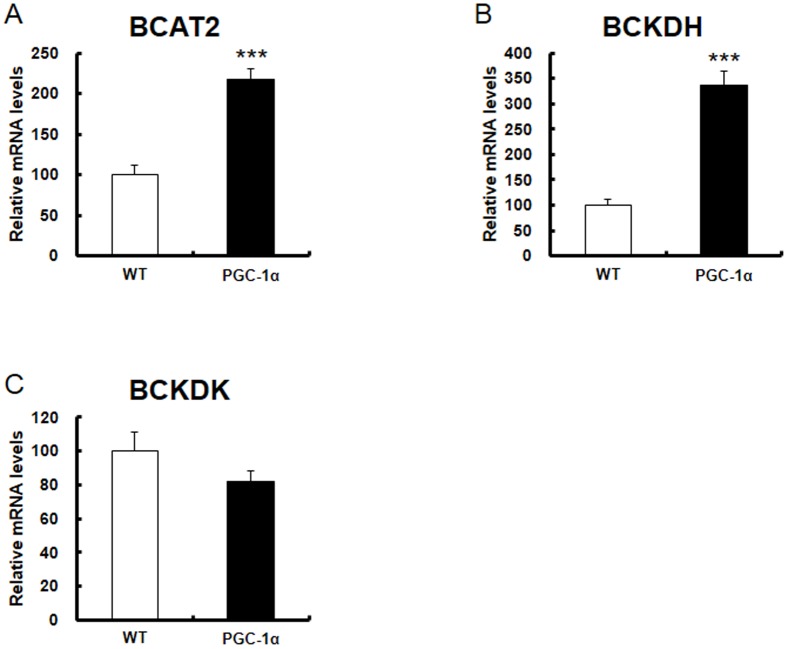
Figure 2. Gene expression of BCAA metabolic enzyme in skeletal muscle of PGC-1α Tg mice.
Expression of A) BCAT2, B) BCKDH, and C) BCKDK genes in WT (control; open columns, N = 9) and PGC-1α Tg (filled columns, N = 7) mice by quantitative real-time RT-PCR. RNA was obtained from mice with feeding condition. These samples were as used in [4]. In the sample, PGC-1α expression was 30 fold higher in Tg mice than in WT mice (Fig. 1 of [4]). The relative values are shown (the control is set as 100). ***P<0.001.

