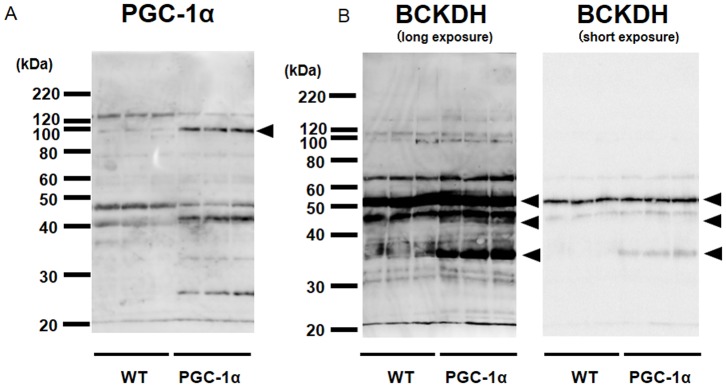
Figure 3. Protein expression of PGC-1α and BCAA metabolic enzymes in skeletal muscle of PGC-1α -Tg mice.

Total lysates from skeletal muscle were subjected to SDS-PAGE, followed by Western blot analysis with indicated antibodies. Typical blots are shown. Densitometric analysis was performed on the bands indicated (arrowheads). Molecular size marked was indicated on the left side of blots. Tg and WT mice were sacrificed at 12 weeks of age (N = 3 for WT and N = 3 for Tg mice). In these samples, we confirmed increased mRNA expression of BCAT2 and BCKDH but not BCKDK as observed in Figure 1 (data not shown).
