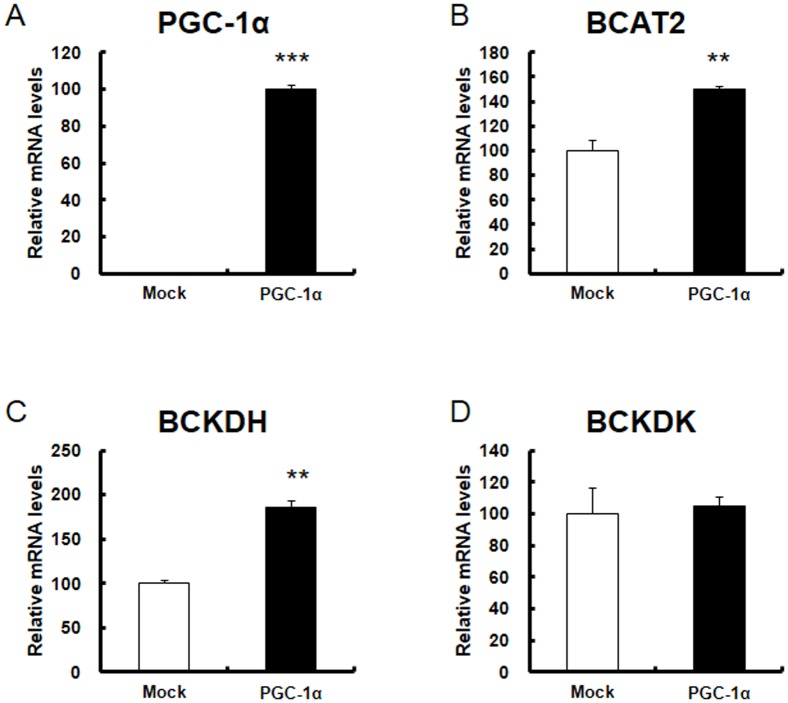
Figure 5. Gene expression of BCAA metabolic enzymes in cultured C2C12 cells overexpressing PGC-1α.
Total RNA was isolated from the cells and analyzed by quantitative real-time RT-PCR with primers for A) PGC-1α, B) BCAT2, C) BCKDHa, and D) BCKDK. Open columns represent mock cells (N = 3), and filled columns represent PGC-1α-overexpressed cells (N = 3). Each value represents mean ± SE (N = 3). The relative values are shown (the control is set as 100). For PGC-1α expression, the value was set as 100 in the PGC-1α overexpressed cells. ***P<0.001, **P<0.01.

