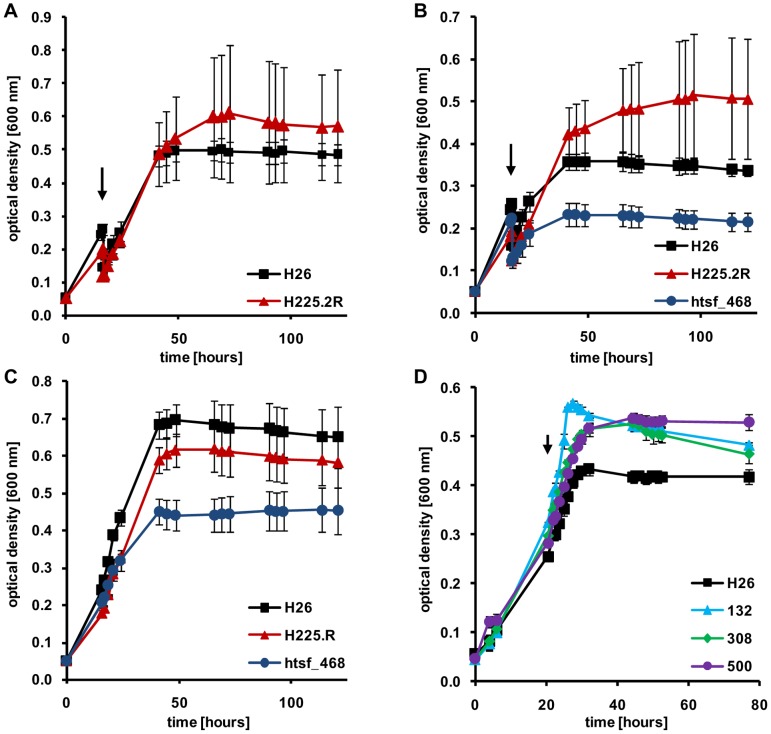
Figure 3. Growth curves of the parent strain (black) and selected mutants (in color) exposed to different stress conditions.
A. Parent strain (blue) and ΔH225.2P (red) after the application of a temperature down-shift (arrow). B. Parent strain, ΔH225.2P (red), and Δhtsf468 (blue) after the application of a osmotic down-shift (arrow). C. The same strains as in B. grown in the absence of stress. D. Parent strain, Δ132 (blue), Δ308 (green), and Δ500 (purple) after the exposure to oxidative stress (arrow).

