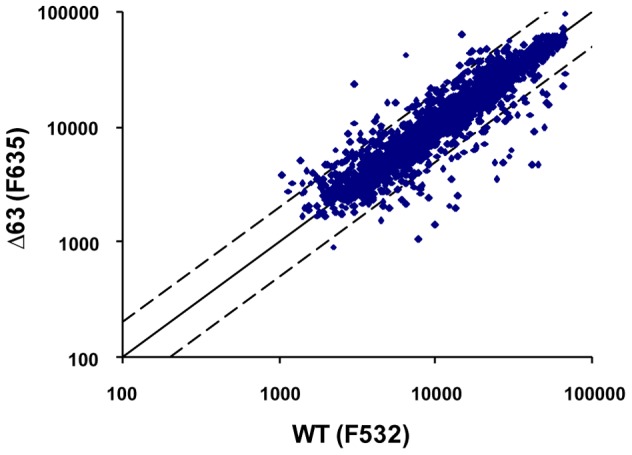
Figure 5. Scatter plot of the microarray analysis of the transcriptomes of parent strain and deletion mutant Δ63.

Average signals of four biological replicates are shown. The experiment included a dye swap. The RNA was isolated after the exposures of the cultures to 1% (v/v) ethanol for 15 minutes. The solid line represents the diagonal (identical transcript levels in parent strain and mutant). The dotted lines represent a twofold difference between parent strain and mutant.
