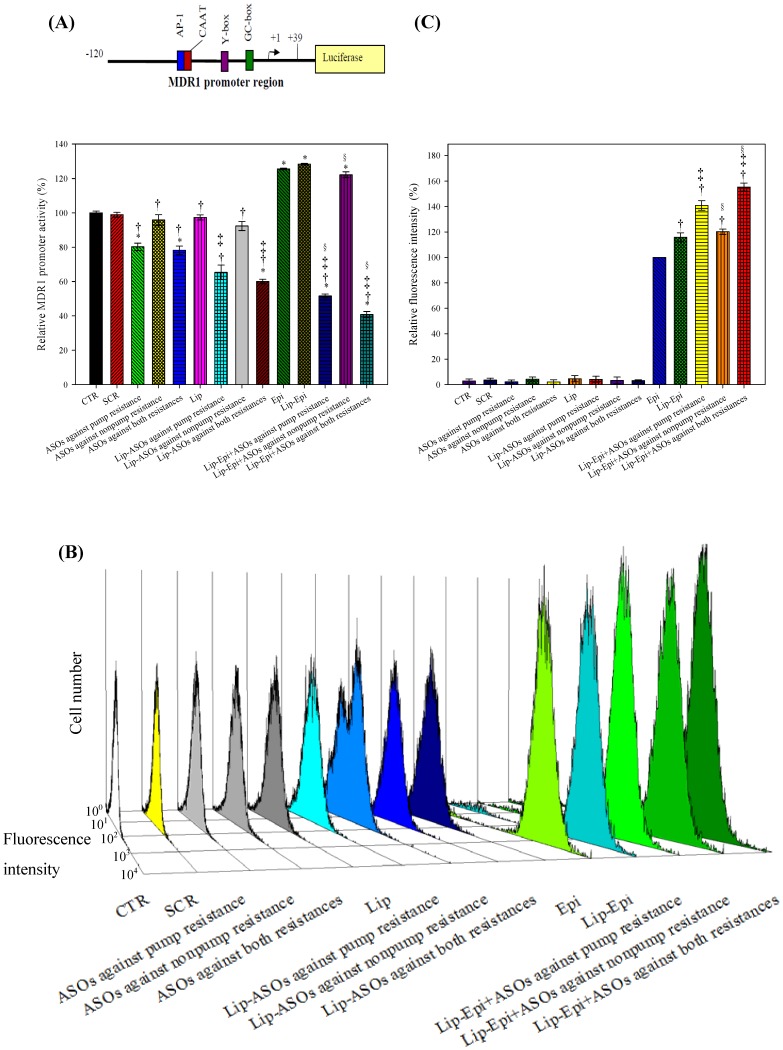
Figure 4. The effect of different treatments on the hMDR1 promoter activity and the intracellular accumulation of epirubicin in Caco-2 cells.
(A) The effect of different treatments for 48 h on the hMDR1 promoter activity in Caco-2 cells. The luminescence was measured using a dual luciferase assay kit with a luminometer. After background correction, results were expressed as the level of hMDR1 promoter-pGL3 activity divided by pRL-TK activity level. * P<0.05 compared to CTR; † P<0.05 compared to Epi; ‡ P<0.05 when liposomal formulation compared to its corresponding free formulation; § P<0.05 when liposomal formulation of Epi plus ASOs compared to its corresponding liposomal formulation of ASO. (B) The effect of different treatments on the intracellular accumulation of fluorescent Epi in Caco-2 cells. The three-dimensional view of cell number versus fluorescence intensity of Caco-2 cells after different treatments was shown. (C) Mean fluorescence intensity of Epi control was normalized to be 100%. Mean fluorescence intensity of the other treatments was normalized relative to the Epi. Data are means ± standard deviation of four independent experiments. The relative fluorescence intensity % of formulations without Epi demonstrates that the auto-fluorescence of these treatments was negligible. † P<0.05 compared to Epi; ‡ P<0.05 compared to Lip-Epi; § P<0.05 compared to Lip-Epi+ASOs against pump resistance.

