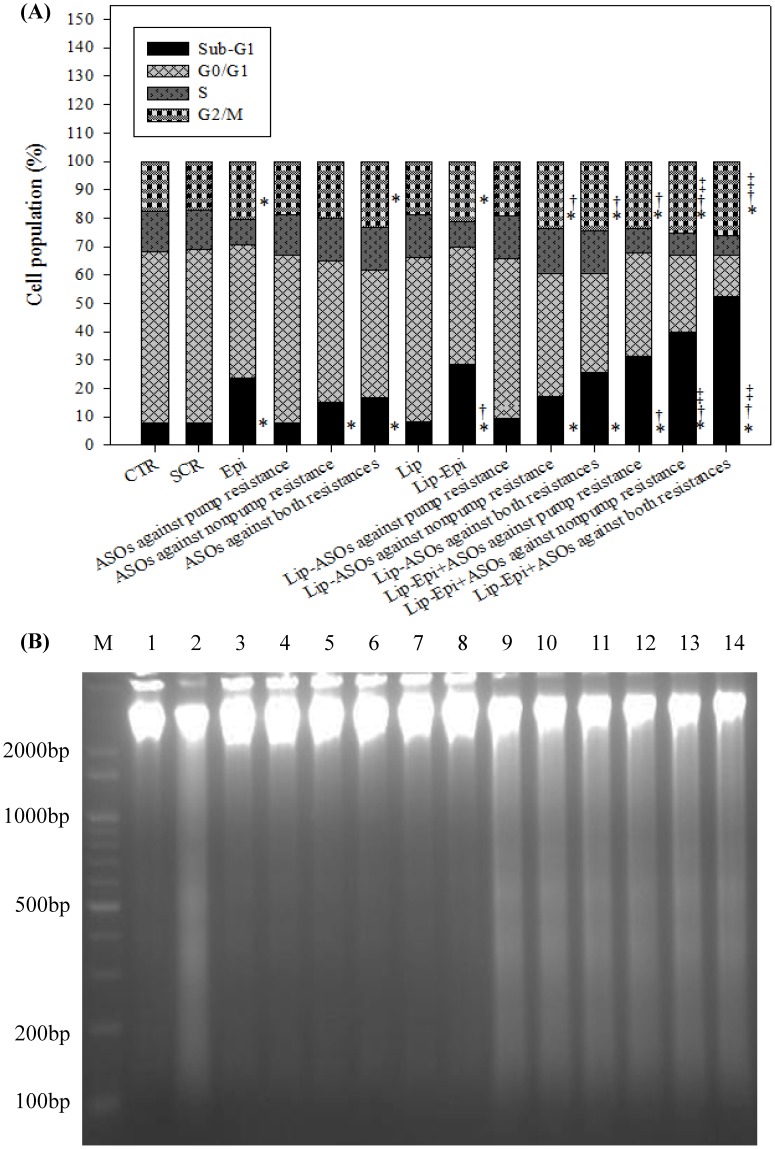
Figure 6. The effect of different treatments on the cell cycle distribution and DNA fragmentation in Caco-2 cells.
(A) Analysis of cell number % of each cell cycle phase relative to total phases using flow cytometry in Caco-2 cells pretreated with different antisense formulations and/or Epi for 48 h. For example, sub-G1% is calculated as the percentage of the number of cells in the sub-G1 population relative to the number of total cells. Means ± S.D. from three independent experiments are shown. * P<0.05 compared to CTR; † P<0.05 compared to Epi; ‡ P<0.05 when liposomal formulation compared to its corresponding free formulation. (B) The DNA fragmentation effect of different treatments on Caco-2 cells for 48 h. DNA was isolated from Caco-2 cells and resolved by electrophoresis on 1.2% agarose gel. The gel was then visualized by SYBR safe staining. M: DNA marker; Lane 1: CTR; Lane 2: Epi; Lane 3: SCR; Lane 4: ASOs against pump resistance; Lane 5: ASOs against nonpump resistance; Lane 6: ASOs against both resistances; Lane 7: Lip; Lane 8: Lip-ASOs against pump resistance; Lane 9: Lip-Epi; Lane 10: Lip-ASOs against nonpump resistance; Lane 11: Lip-ASOs against both resistances; Lane 12: Lip-Epi+ASOs against pump resistance; Lane 13: Lip-Epi+ASOs against nonpump resistance; Lane 14: Lip-Epi+ASOs against both resistances.

