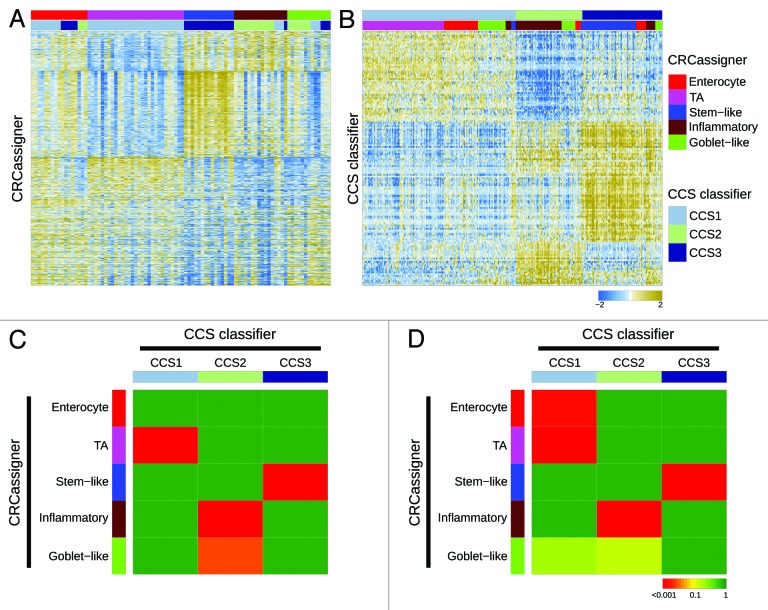
Figure 2. Relationships of colorectal cancer subtype classifications. (A and B) Heatmaps depict the AMC-AJCCII-90 data set classified according to the CRCassigner signature (A) and the Sadanandam et al. core data set classified based on the CCS classification (B). Columns represent patients; rows indicate CRCassigner genes (A) or CCS classifier genes (B). Colors represent relative gene expression levels; blue signifies low expression, and brown high expression. (C and D) Heatmaps indicate association of CRCassigner subtype samples (left) with CCS group samples (top) for the AMC-AJCCII-90 set (C) and the Sadanandam et al. core data set (D). Colors indicate significance of association; green signifies a low association, and red a high association. P values are determined using hypergeometric tests.

An official website of the United States government
Here's how you know
Official websites use .gov
A
.gov website belongs to an official
government organization in the United States.
Secure .gov websites use HTTPS
A lock (
) or https:// means you've safely
connected to the .gov website. Share sensitive
information only on official, secure websites.
