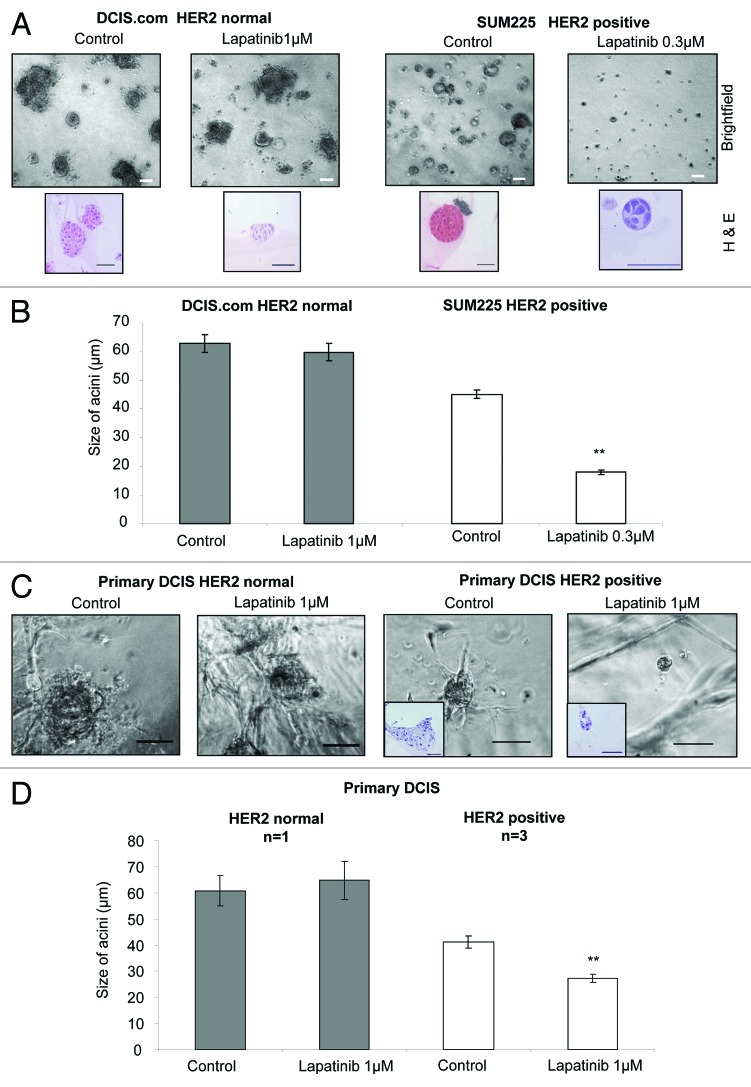
Figure 2. Lapatinib reduces acini size of a HER2-positive cell line and primary DCIS samples. (A) Brightfield and Haematoxylin and Eosin images of day 15 acini with control and lapatinib treatment 1 μM and 0.3 μM in DCIS.com or SUM225 cells, respectively. (B) Graph showing size of acini (μm) after 10 d of 3D matrigel culture with 1 μM and 0.3 μM Lapatinib treatment in DCIS.com or SUM225 cells, respectively, 3 independent experiments. (C) Images of HER2 normal and HER2-positive human primary DCIS grown in 3D matrigel culture with control or lapatinib (1 μM) treatment. Inserts shown on HER2-positive sample show Haematoxylin and Eosin staining of a cross section through acini. (D) Graph showing HER2-positive (n = 3) and HER2 normal (n = 1) human primary DCIS cells grown in matrigel in the presence or absence of Lapatinib (1 μM). n represents number of independent human DCIS samples. Scale bar represents 50 μm. Mean ± standard error. Mann–Whitney U test, 2-tailed, * P ≤ 0.02, ** P ≤ 0.0001.

An official website of the United States government
Here's how you know
Official websites use .gov
A
.gov website belongs to an official
government organization in the United States.
Secure .gov websites use HTTPS
A lock (
) or https:// means you've safely
connected to the .gov website. Share sensitive
information only on official, secure websites.
