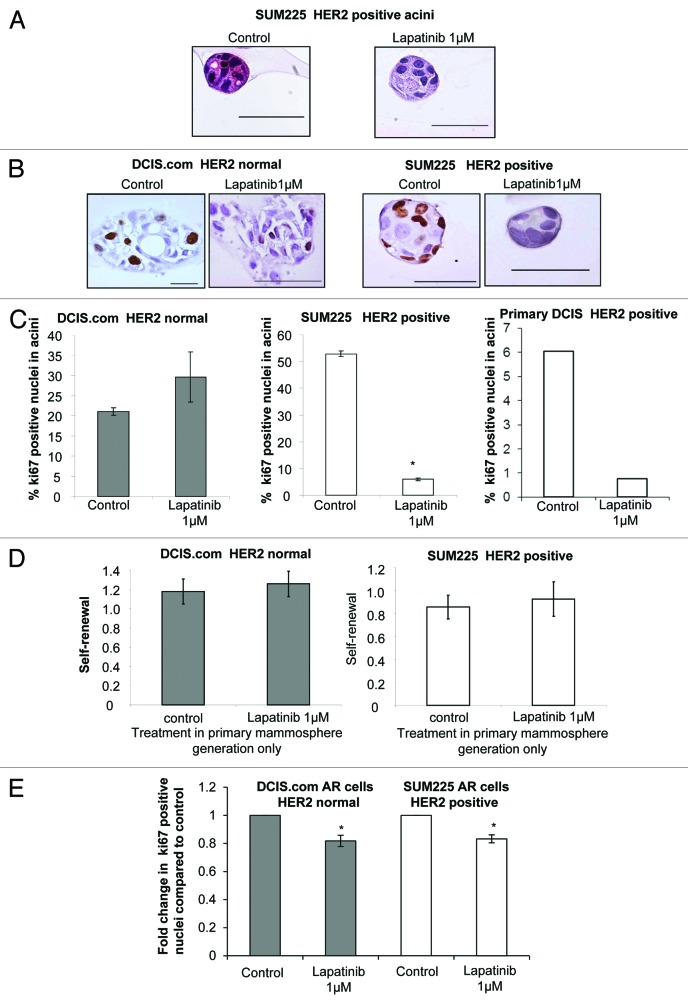
Figure 3. Proliferation of acini and DCIS stem/progenitor cells is reduced after treatment with Lapatinib (A) Haematoxylin and Eosin staining of sections through control and Lapatinib 0.3 μM treated SUM225 acini at day 15 of matrigel culture. (B) Images of Ki67 staining of acini formed from control or Lapatinib-treated (1 or 0.3 μM) DCIS.com and SUM225 cell lines. (C) Graphs showing the percentage positive Ki67 nuclei from DCIS.com, SUM225, and a primary DCIS acini grown in control or Lapatinib at 1 μM, respectively. Mean ± standard error, Unpaired t test, 2-tailed, unequal variance, * P < 0.0001. (D) Graphs showing the self-renewal capacity of DCIS.com and SUM225 cells as measured by secondary mammosphere formation from primary generation mammospheres treated with control or Lapatinib (1 μM) (No further treatment is given in secondary mammosphere generation). (E) Graph showing fold change in Ki67-positive cells within the anoikis-resistant (AR) populations of DCIS.com and SUM225 cells in the presence or absence of Lapatinib (1 μM). Mean ± standard error, 3 independent experiments in triplicate, Mann–Whitney U test, 2-tailed *P ≤ 0.0286, **P ≤ 0.001.

An official website of the United States government
Here's how you know
Official websites use .gov
A
.gov website belongs to an official
government organization in the United States.
Secure .gov websites use HTTPS
A lock (
) or https:// means you've safely
connected to the .gov website. Share sensitive
information only on official, secure websites.
