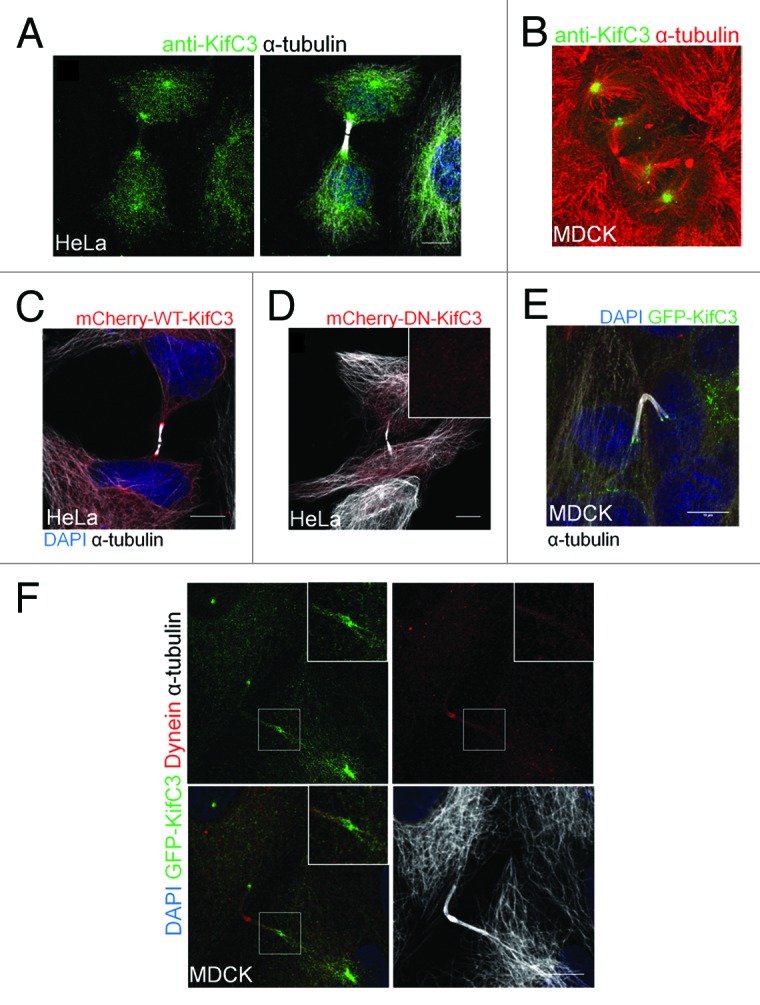
Figure 2. KIFC3 flanks the central spindle during cytokinesis. (A and B) Staining of endogenous KIFC3 (A) HeLa cells were stained with anti-KIFC3 (Lab; green), DAPI (blue), and α-tubulin (white). (B) MDCK cells were stained with anti-KIFC3 (green) and α-tubulin (red). (C–E) Only WT-KIFC3 flanks the central bridge. (C) HeLa cells were transfected with WT- (C) or DN-KifC3 mcherry (D) (red) and stained for DAPI (blue; only C) and α-tubulin (white). (E) MDCK cells stably expressing WT-KIFC3 GFP (green) were stained for DAPI (blue) and α-tubulin (white). (F) MDCK cells stably expressing KIFC3-GFP were stained with DAPI (blue), dynein (red), and α-tubulin (white). Region of interest is enlarged in box on upper left of each panel. (A–E) Maximum projections are shown, (F) single slice is shown. Scale bars = 10 μm
