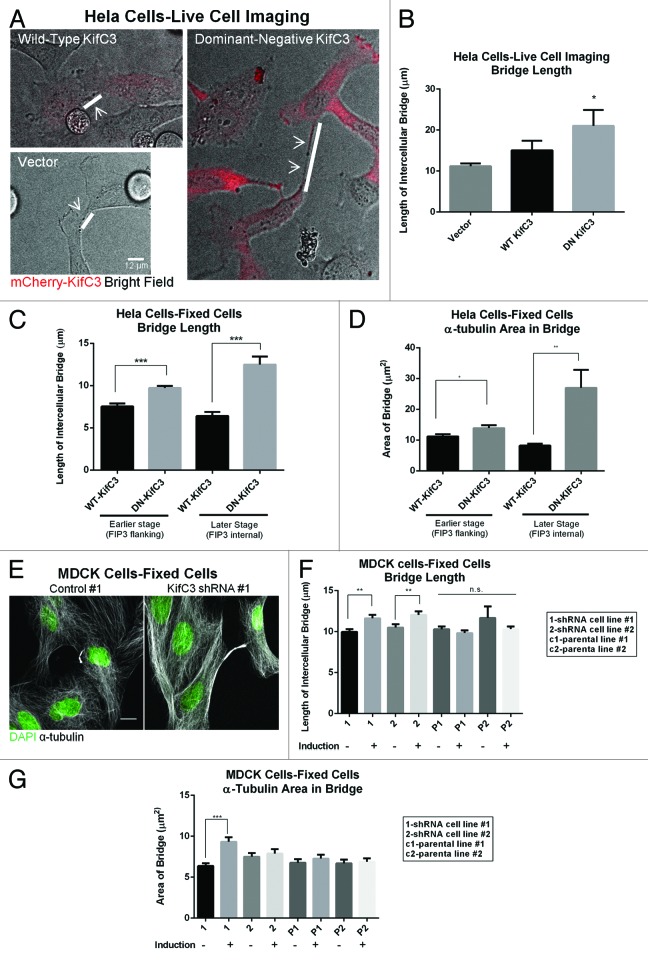
Figure 3. Perturbation of KIFC3 increases intercellular bridge length and bridge area. (A) Single frames from live cell imaging of HeLa cells expressing WT- or DN-KIFC3 mCherry (red) or an empty vector. White bars and arrows highlight the bridge. Scale bar = 12 μm. (B) Quantitation of (A), n > 170 cells for each condition. (C and D) Quantitation of bridge length (C) and bridge area (D) from fixed HeLa-FIP3 GFP cells expressing WT or DN KIFC3, n > 30 cells for each condition. (E) MDCK cells uninduced (control) or induced to express an shRNA against KIFC3. (F and G) Quantitation of bridge length (F) and bridge area (G) of uninduced and induced cells expressing KIFC3 shRNA and parental controls, n > 60 cells for each condition from 2 independent experiments. Scale bar = 10 μm. Error bars in (B) are s.d., all other error bars are s.e.m. *P < 0.05, **P < 0.005, ***P < 0.0001.

An official website of the United States government
Here's how you know
Official websites use .gov
A
.gov website belongs to an official
government organization in the United States.
Secure .gov websites use HTTPS
A lock (
) or https:// means you've safely
connected to the .gov website. Share sensitive
information only on official, secure websites.
