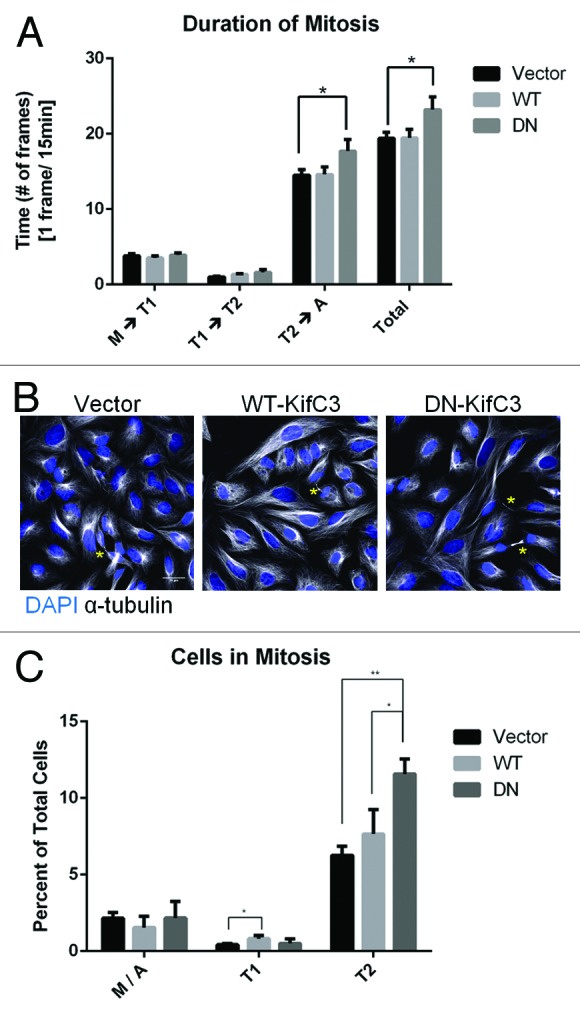
Figure 4. Increased bridge length is correlated with a delay in abscission. (A) HeLa cells expressing WT- or DN-KIFC3 or an empty vector were imaged live and the duration of each mitotic stage was quantified, see text for details. Error bars are s.e.m and n > 40 cells for each condition from two independent experiments. (B) HeLa cells expressing an empty vector or WT- or DN-KIFC3 were stained with DAPI (blue) and α-tubulin (white). Cells in telophase are marked with an asterisk. (C) Quantitation of (B). Error bars are s.d. and n > 1800 cells for each condition from 3 independent experiments. *P < 0.05, **P < 0.005. Scale bar = 30 μm.
