
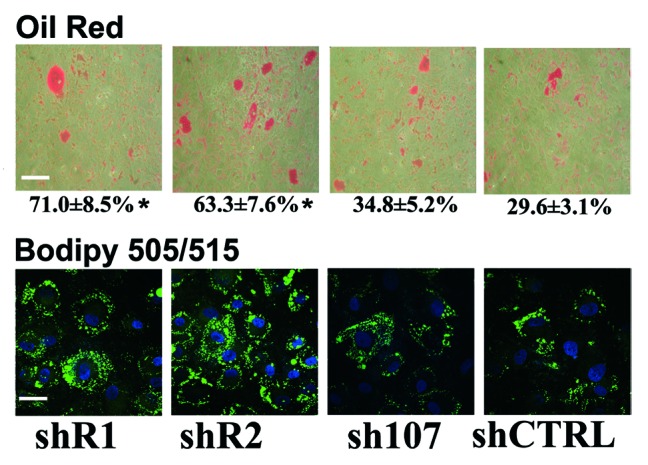
Figure 2. BMSC differentiation into adipose cells. The picture shows representative microscopic fields of BMSC induced to differentiate into adipocytes and stained with Oil Red O or with Bodipy 505/515. Scale bar: 80 µM The percentage of Oil Red O-positive cells is indicated. Data are expressed as mean values with standard deviations (*P < 0.05). shR1, shR2, shP107 are cells with silenced RB1, RB2/P130, and P107, respectively. Control cultures are indicated as shCTRL. Scale bar: 30 µM.