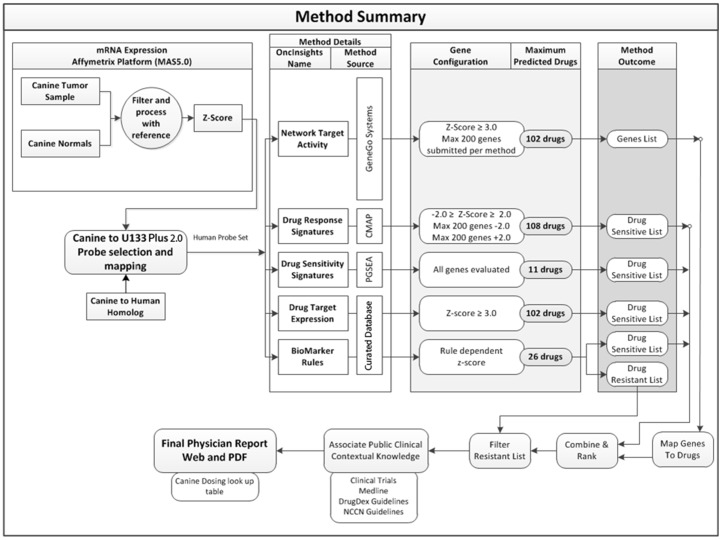
Figure 2. Bioinformatic analysis defines the platform for PMed report generation.
Gene expression data from each tumor was compared to a reference sample set (canine normal tissue compendium, GSE20113 from Gene Expression Omnibus) to obtain a relative gene expression profile. Each gene probeset was represented by a z-score depicting its expression in the tumor in terms of the number of standard-deviations from the mean expression in the reference set. In the iteration of the PMed tools used in this study, data were analyzed by six distinct predictive methodologies (Drug Target Expression, Drug Response Signatures, Drug Sensitivity Signatures, Network Target Activity, Biomarker-Based-Rules-Sensitive, Biomarker-Based-Rules-Insensitive) to identify (or exclude in the case of biomarker resistant rules) potential agents for consideration. All predictions were based on the conversion of canine genomic data into human homologs (for both patient tumor samples and the reference set of normal tissues) prior to the application of the specific algorithms that rely exclusively on human knowledge and/or empirical drug screens using human cell lines (see Methods). While individual patient tumor PMed report generation and distribution was the final step in this process, this specific study did not have therapeutic intent and drug prescription was not performed.

