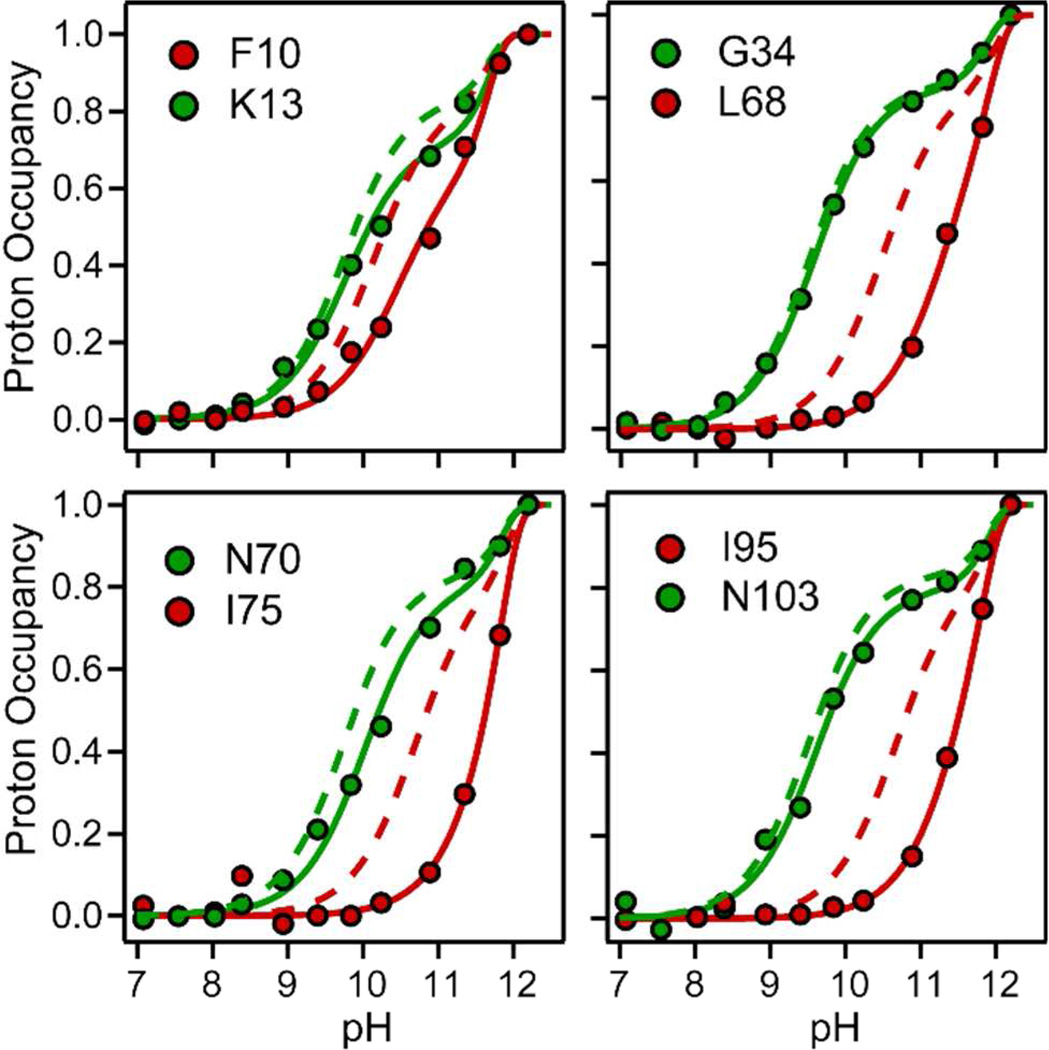
Figure 2.
pH-dependent competition between D-H exchange and folding of cyt c at constant time (140 µs, 22 °C). Normalized proton occupancies for representative residues (symbols, solid lines) are compare with the pH profiles predicted for the corresponding residues in the unfolded state (dashed lines). Solid lines represent fits of Eq. 1 to the data.

