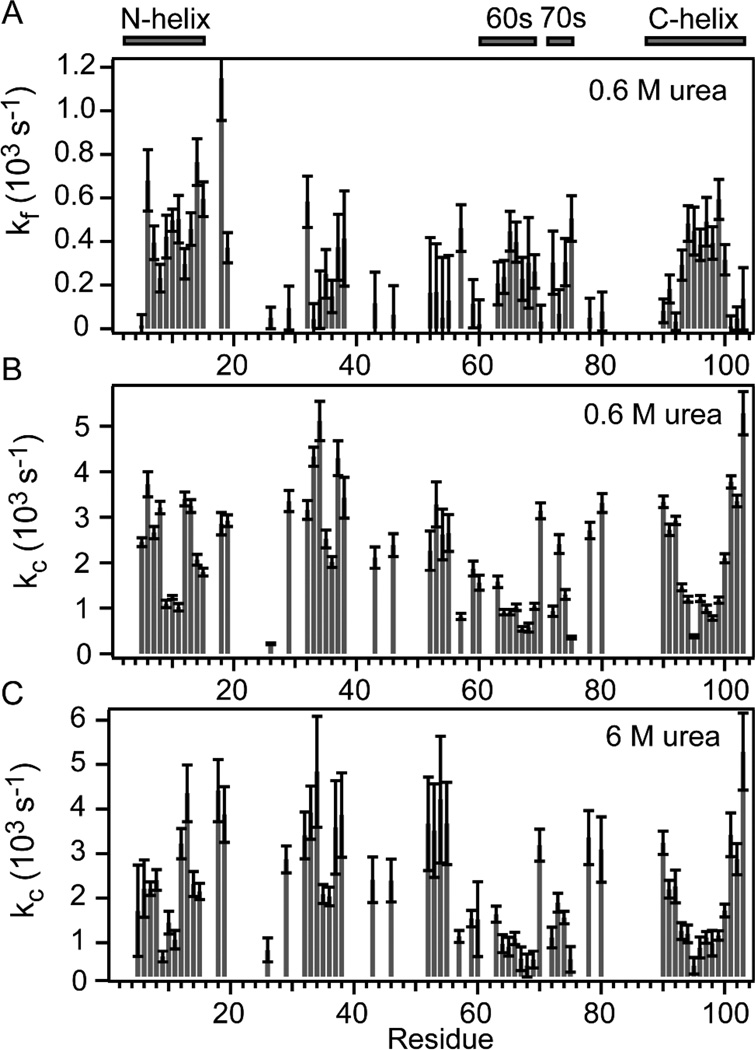
Figure 4.
Sequence dependence of time-dependent competition and exchange results. The bar graphs in panels A and B show effective protection rates (kf) and intrinsic exchange rates (kcU), respectively, at 0.6 M urea obtained from least-squares fitting of Eq. 2 to the competition data in Figure S3. Panel C shows direct exchange rates for unfolded cyt c at 6 M urea vs. residue number.

