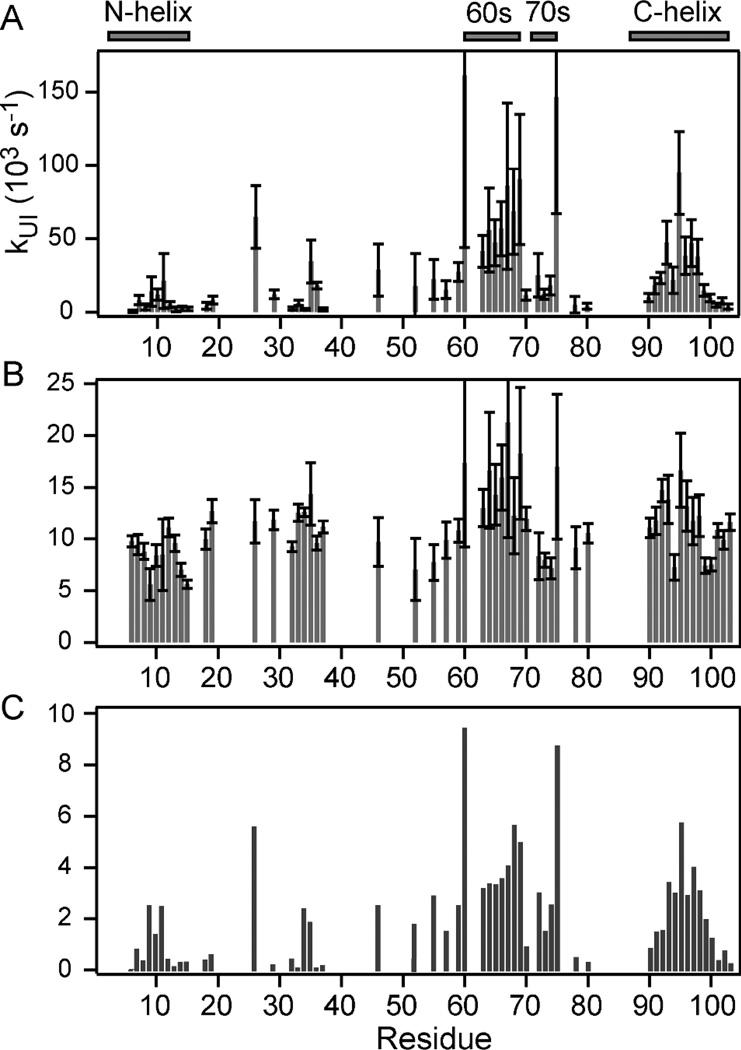
Figure 5.
Summary of pH-dependent exchange/folding competition data for the compact intermediate, I, of cyt c populated at a folding time of 140 µs. Panels A and B show bar graphs of the local rate constants for formation (kUIloc) and unfolding (kIUloc) of the I-state vs. residue number obtained by fitting Eq. 1 to the data in Figure S2. The corresponding equilibrium constants, KUIloc = kUIloc/kIUloc, are plotted in panel C.

