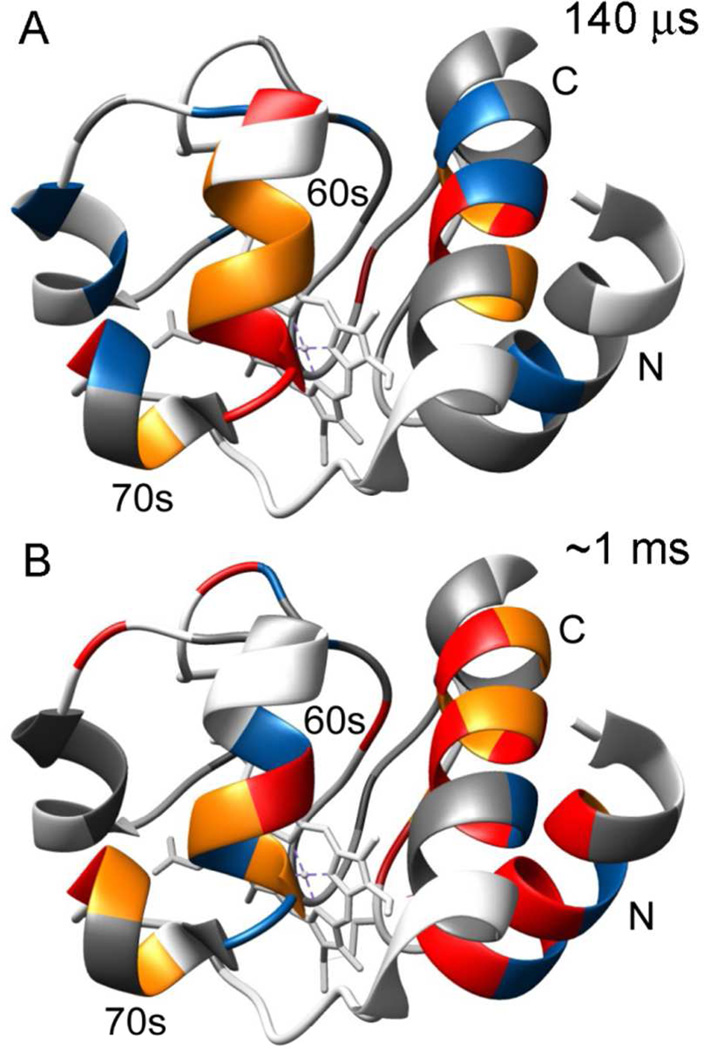
Figure 6.
Ribbon diagrams of the X-ray structure of native horse cytochrome c (pdb 1hrc) color-coded to show amide protection patterns at folding times of 140 µs (A) and ~1 ms (B). In both panels, residues that are protected in the native state, but unprotected in the I-state (KUIloc < 2; kfloc <200) are shown in gray. The pH-dependent competition results (Figure 5C) are summarized in panel A, where residues with low (2 ≤ KUIloc < 3), intermediate (3 ≤ KUIloc < 4) and high (KUIloc ≥ 4) are colored blue, orange and red, respectively. The time-dependent competition data (Figure 4A) are summarized in panel B, where residues with low (200 ≤ kfloc < 300), intermediate (300 ≤ kfloc < 400) and high (kfloc ≥ 400) are colored blue, orange and red, respectively.

