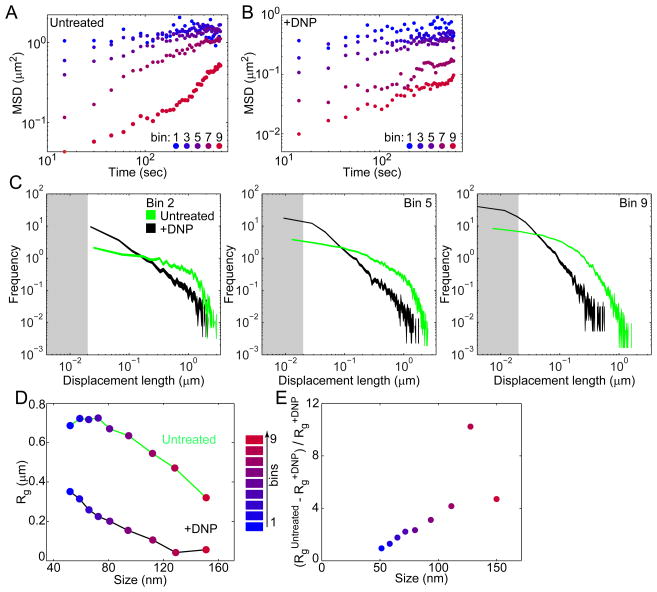
Figure 3. Effect of metabolism on cytoplasmic motion depends on particle size.
(A) MSD of GFP-μNS particles of varying binned fluorescence intensities in E. coli cells (CJW4617) under normal growth conditions (M2G).
(B) Same as A, but for GFP-μNS particles in E. coli cells (CJW4617) under DNP treatment.
(C) Histograms of GFP-μNS particle displacements under untreated and DNP-treated conditions for selected bins. Displacements were measured over 15-sec intervals. Line width indicates Poisson counting error, and the gray shading delineates the estimated tracking error.
(D) Mean radius of gyration (Rg) of all trajectories from GFP-μNS particles of a given binned size is plotted as a measure of spatial exploration for untreated and DNP-treated cells.
(E) The ratio is plotted as a function of particle size.
See also Figs. S6–7.

