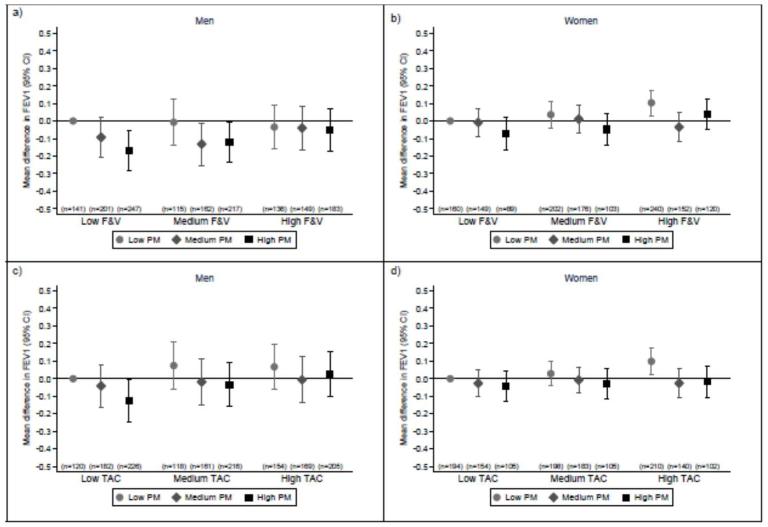
FIGURE 1. Interactions between processed meat consumption and fruit and vegetable consumption and dietary TAC on forced expiratory volume in 1 s (FEV1).
Interactions between processed meat (PM) consumption and fruit and vegetable (F&V) consumption (a for men and b for women) or dietary total antioxidant capacity (TAC) (c for men and d for women) on FEV1. Dietary variables were stratified by tertiles (low: <2.5 servings/week; medium 2.6–4.7 servings/week; and 4.9+ servings/week for processed meat, low: <37.5 servings/week; medium: 37.5–53.2 servings/week; and high: 53.2+ servings/week for fruit and vegetables and low: <13700 μmol/d; medium: 13700–18245 μmol/d; and high: 18245+ μmol/d for dietary TAC). Values are multivariate-adjusted regression coefficients for the difference in mean FEV1 compared to subjects with the lowest consumption of both processed meat and dietary antioxidants.

