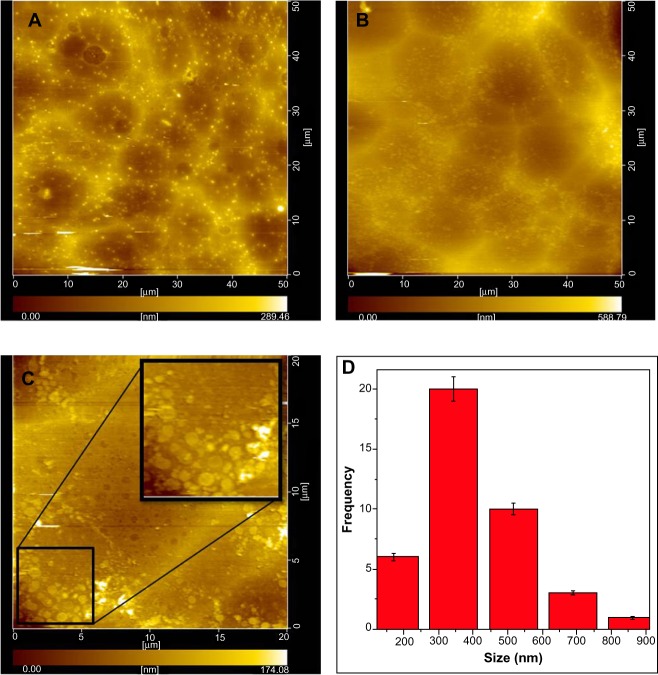
Figure 6.
Noncontact AFM images of CL (A) and GC7 (B) on glass (focus area equal to 50 μm × 50 μm) showing topography and a magnified image of an area of GC7 (20 μm × 20 μm) (C) showing G flakes (inset) and the histogram showing a maximum frequency in 300–350 nm range (D).
Abbreviations: AFM, atomic force microscopy; CL, collagen; GC7, GC7, 7-day graphite/collagen dispersion.

