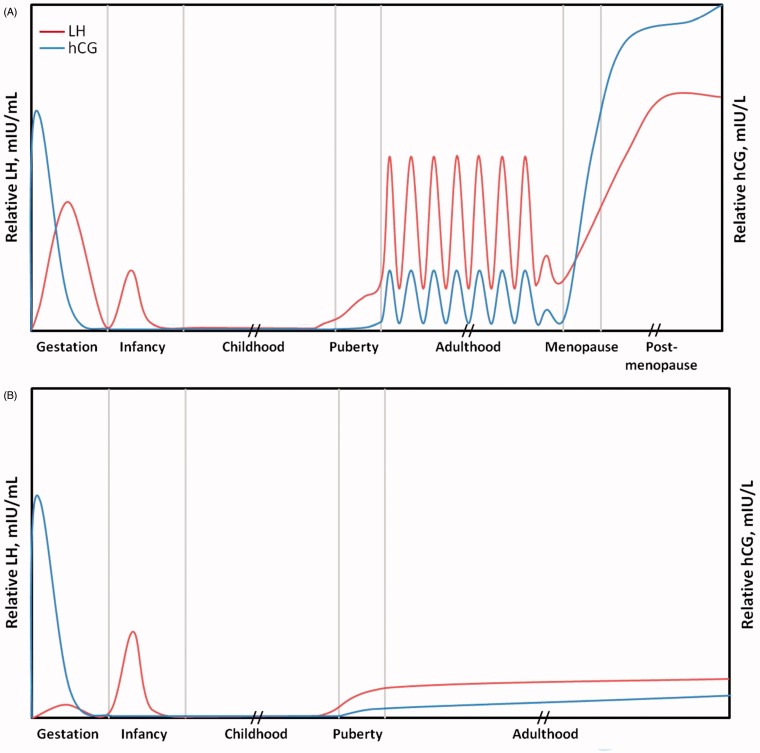
Figure 1.
Relative expression of luteinizing hormone (LH) and human chorionic gonadotropin (hCG) during the stages of life in females (A) and males (B). Note that patterns of LH and hCG expression will vary substantially from person to person. This figure is a representation of which molecule is predominant at the different stages of life. It is not an exact measurement.

