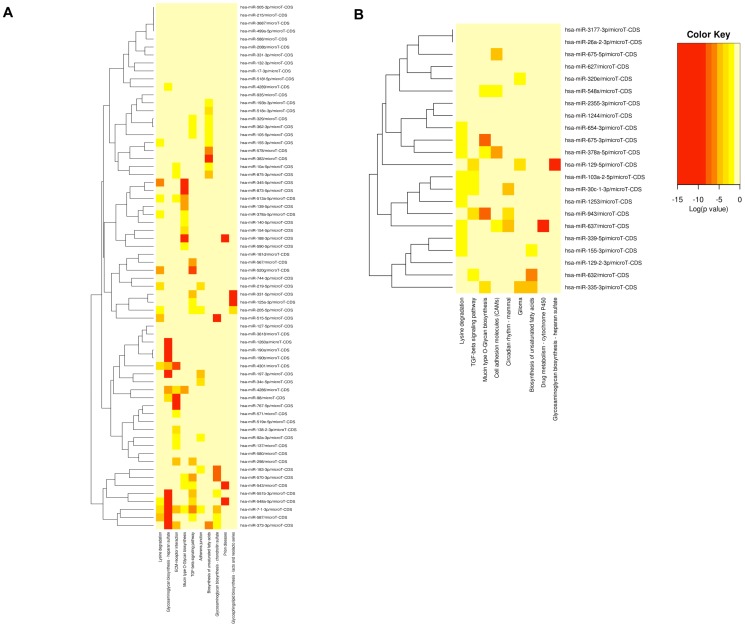
Figure 5. Pathway analysis and validation in treated LX2 cells.
Heat map showing predicted pathways for the miRNAs that were differentially modulated in LX2 cells treated with supernatants from (A) R5-tropic or (B) X4-tropic HIV-1 infected PBMCs. DIANA miRPath v2.0 was used to predict the pathways with default p-value threshold of 0.05 and microT threshold of 0.8. This clustering is based on significance analysis. All significantly targeted pathways are marked with deep red. On the vertical axis, miRNAs are clustered together by exhibiting similar pathway targeting patterns.

