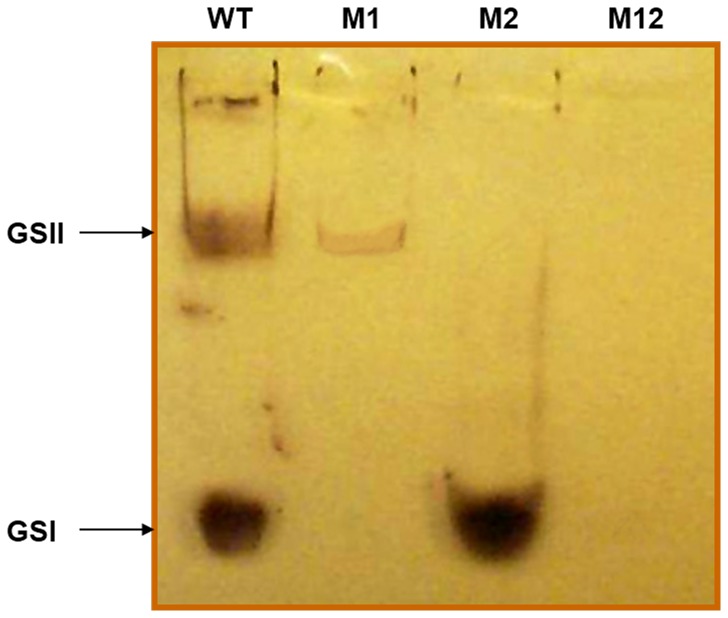
Figure 3.
Zymogram analysis of GS activity from wild-type and mutant cells. Ten µg of each soluble extract was subjected to native PAGE. The bands showing GS activity were visible after overnight incubation in a buffer containing ADP-glucose and rabbit-liver glycogen and were stained with iodine solution. Lane 1. WT, Lane2. M1 (sll1393−), Lane3. M2 (sll0945−), and Lane 4. M12 (sll1393−/sll0945−).

