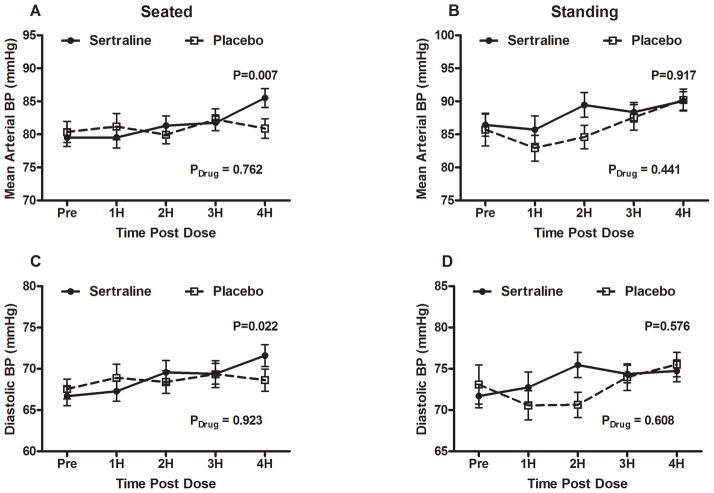
Figure 2. Mean arterial blood pressure and diastolic blood pressure profiles of placebo and sertraline groups.
(A) Seated MAP, (B) standing MAP, (C) seated DBP, and (D) standing DBP profiles for placebo vs. sertraline 50mg are presented with BP measurements at baseline and at hour intervals for 4 hours after administration. Solid circles represent sertraline values while open boxes represent placebo values. P-value of paired samples t-test (2 tailed) for blood pressures at 4 hours between placebo and sertraline are shown. Repeated measures analysis of variance P values are also presented for the overall effect of the study drug over time (Pdrug).
MAP: mean arterial pressure; DBP: diastolic blood pressure

