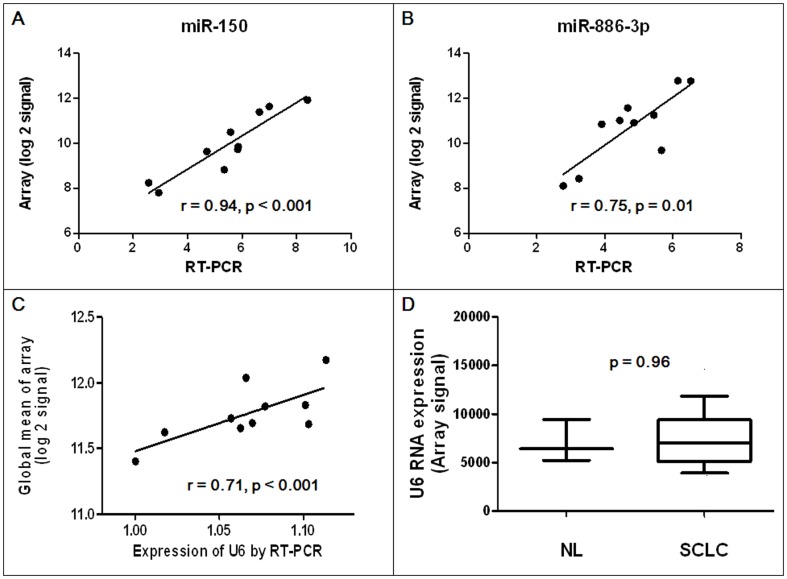
Figure 3. Correlation between RT-PCR Ct and log 2-transformed array signal intensity values for (A) miR-150 and (B) miR-886-3p.
(C) Correlation between expression of U6 RNA by qRT-PCR and log 2-transformed global mean array expression. (D) Expression of U6 RNA in human normal lung (NL, n = 3) and small-cell lung cancer (SCLC, n = 42) samples by microarray method. Whiskers depict the 10 and 90 percentiles. p value is calculated by the Mann-Whitney U test.

