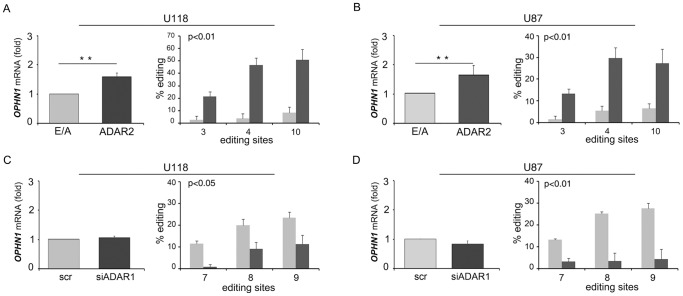
Figure 4. OPHN1 RNA editing and expression in astrocytoma cell lines.
(A) OPHN1 mRNA expression (left panel) and editing levels at ADAR2-specific sites (right panel) in U118 ADAR2 E/A (light grey) and U118 ADAR2 (dark grey) cells. The expression levels were calculated as a relative-fold increase compared to inactive ADAR2 (E/A) arbitrarily set to 1. Each sample was normalized to β-actin mRNA levels. Mean ± s.d. (n = 3), ** p<0.01. (B) The same experiments showed in (A) were performed in the U87 cell line. (C) OPHN1 mRNA expression (left panel) and editing levels at the ADAR1-specific sites (right panel) in U118 scramble (light grey) and U118 siADAR1 (dark grey) cells. The expression levels of the samples were calculated as a relative-fold increase compared to the scramble arbitrarily set to 1. Each sample was normalized to β-actin mRNA levels. Mean ± s.d. (n = 3). (D) The same experiments showed in (C) were performed in the U87 cell line.

