
Fig. 6.
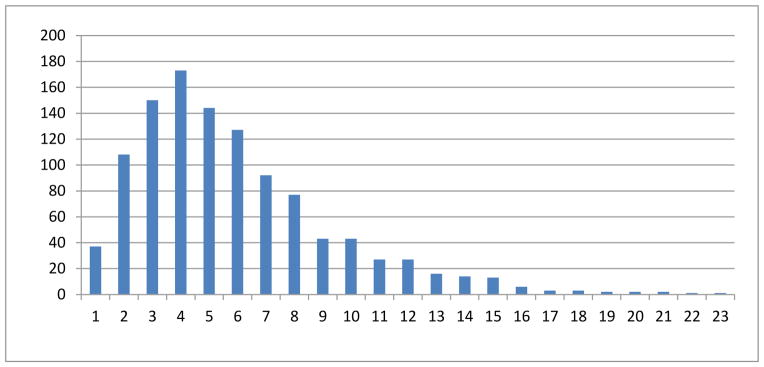
The histogram of the number of DICCCOLs in functional networks. The horizontal axis represents the numbers of DICCCOLs associated with functional networks, while the vertical axis is the number of networks. The index of DICCCOLs in the cortical surface are shown in Fig. 5. We fitted a Gaussian distribution model to the histogram. For those networks with more than 16 counts, we have over 95% confidence level.