. 2014 Mar 5;24(2):96–101. doi: 10.2188/jea.JE20130177

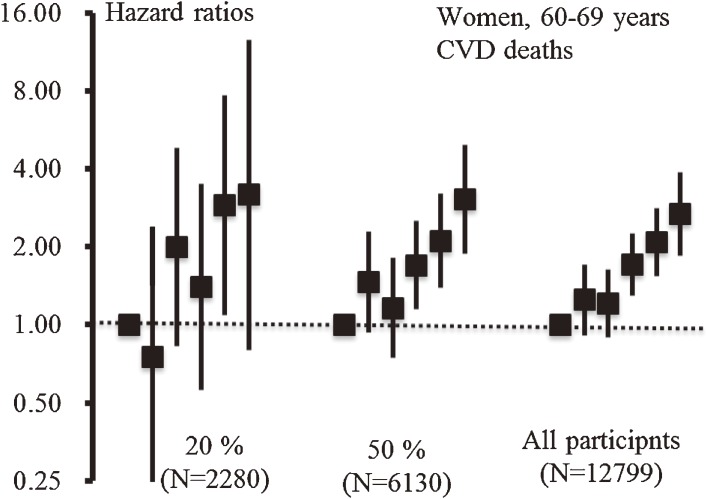
Figure 1. Relationship between blood pressure and cardiovascular disease deaths among different sampling sets: women aged 60–69 years, EPOCH-JAPAN. Three different sampling sets were generated and analyzed separately. The samples were set as follows: 20% sampling (2280 participants), 50% sampling (6130 participants), and all participants (12 799). Blood pressure measurements (unit: mm Hg; SBP, systolic blood pressure; DBP, diastolic blood pressure) were grouped into 6 categories (SBP < 120 and DBP < 80 (reference), 120 ≤ SBP < 130 or 80 ≤ DBP < 85, 130 ≤ SBP < 140 or 85 ≤ DBP < 90, 140 ≤ SBP < 160 or 90 ≤ DBP < 100, 160 ≤ SBP < 180 or 100 ≤ DBP < 110, and 180 ≤ SBP or 110 ≤ DBP). The error bars show 95% CIs.

Figure 1.