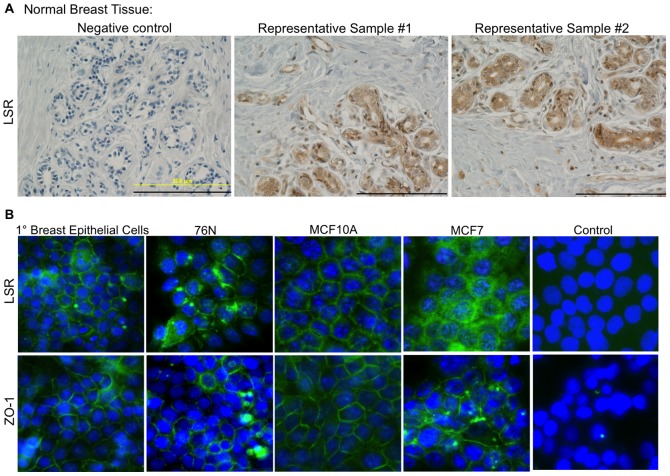
Figure 1. LSR protein expression in breast tissue and epithelial cells.
(A) Representative images of normal breast tissue arrays subjected to immunohistochemical analysis using a LSR specific antibody or corresponding negative control. Scale bar = 200 uM. (B) Representative images of breast epithelial cells subjected to immunocytofluorescence using LSR and ZO-1 specific antibodies (DNA stained with DAPI). Control images are primary breast epithelial cells simultaneously subjected to all steps with the exception of the addition of the primary antibody. Images were obtained at 20X.

