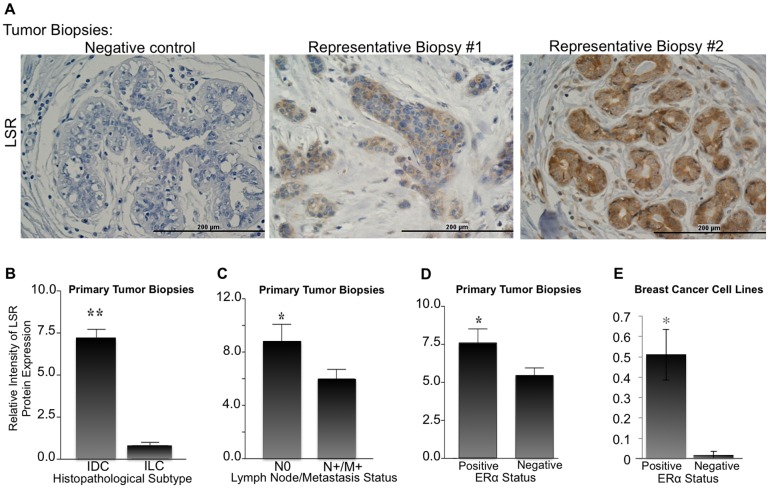
Figure 2. LSR protein expression in breast biopsies and correlation with clinical variables.
(A) Representative images of breast cancer biopsy tissue arrays subjected to immunohistochemical analysis using a LSR specific antibody or corresponding negative control. Scale bar = 200 uM. Intensity of LSR expression in correlation with (B) breast cancer subtype IDC = invasive ductal carcinoma, ILC = invasive lobular carcinoma, (C) tumor invasion into sentinel lymph node and/or distant metastasis, (C) ERα status in tumor biopsy, and (D) ERα status in ERα positive breast cancer cell lines (MCF7, ZR75-1, and T47D) and ERα negative breast cancer cell lines (MDA-MD-231, SUM159, Hs578t). Data represent mean relative intensity +/− SE. *P<0.05, **P<0.01. A total of 248 patient samples were analyzed.

