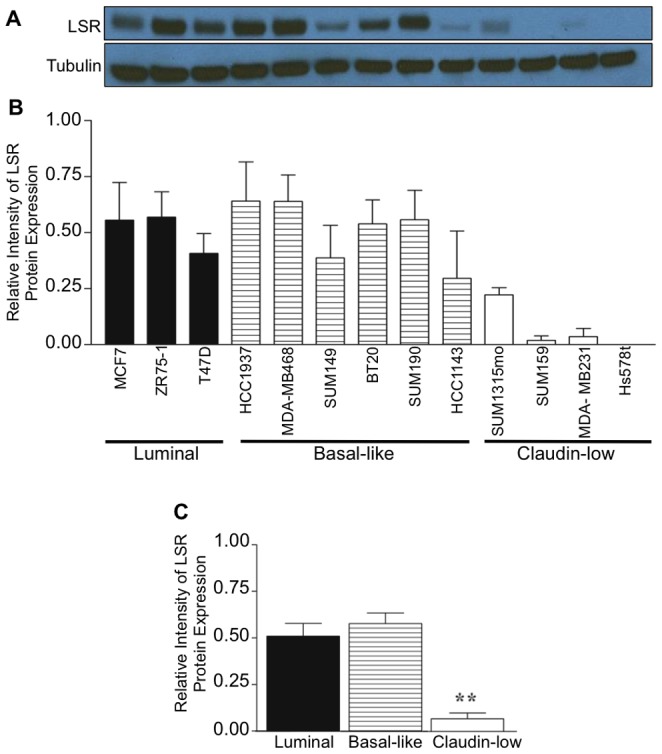
Figure 3. LSR expression in breast cancer molecular subtypes.

Representative breast cancer cell lines were grown to 80% confluence, lysates were isolated and analyzed via western analysis using a LSR specific antibody; α-tubulin was used as a loading control. (A, B) Representative western blot and corresponding intensity measured via ImageJ. (C) Analysis based on molecular subtype of cell lines. Data represent mean relative intensity +/− SE. **P<0.01.
