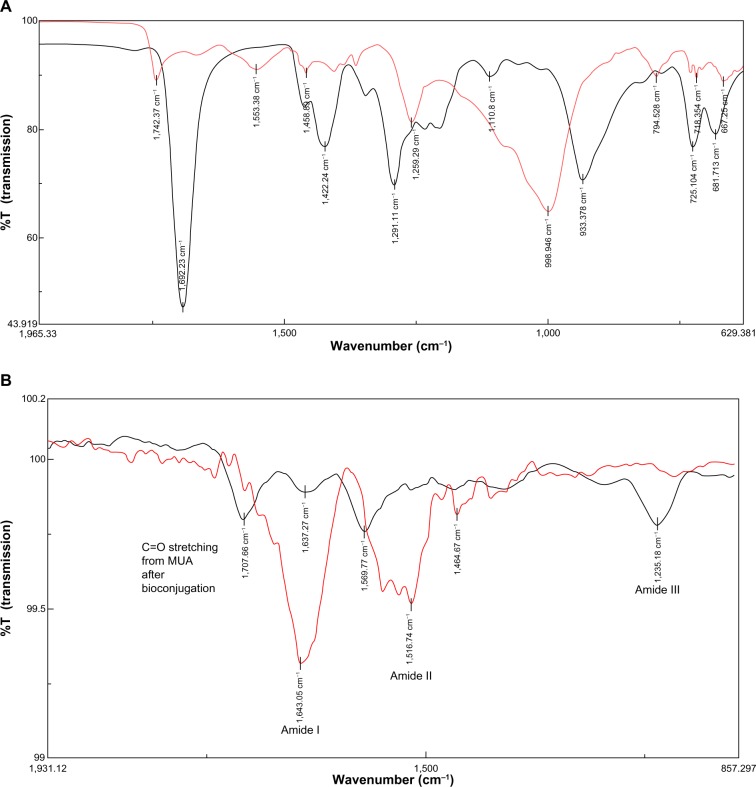
Figure 6.
Fourier transform infrared spectra of (A) CdTe/CdSe/ZnSe MUA QDs (red) compared with MUA (black); (B) anti-HER2-antibody (red) compared with bioconjugated QD-antibody (black).
Notes: (A) The MUA peak at 933 cm−1 from the O–H groups on the acid shifts to 998 cm−1 when MUA binds to the QD, indicating O–H bending. (B) The antibody alone shows prominent peaks at 1,643 cm−1 from amide I and 1,516 cm−1 from amide II. The peak at 1,516 cm−1 shifts to 1,569 cm−1 on the bioconjugated QD, showing stretching of the C–N and NH groups. A new peak at 1,235 cm−1 may represent amide III linkage. The peak at 1,707 cm−1 may occur from stretching of the C=O bond on the MUA after bioconjugation. The prominent O–H peak at 998 cm−1 disappears in the bioconjugate, indicating formation of the amide bond.
Abbreviations: MUA, mercaptoundecanoic acid; QDs, quantum dots; HER2, human epidermal growth factor receptor 2.

