Figure 7.
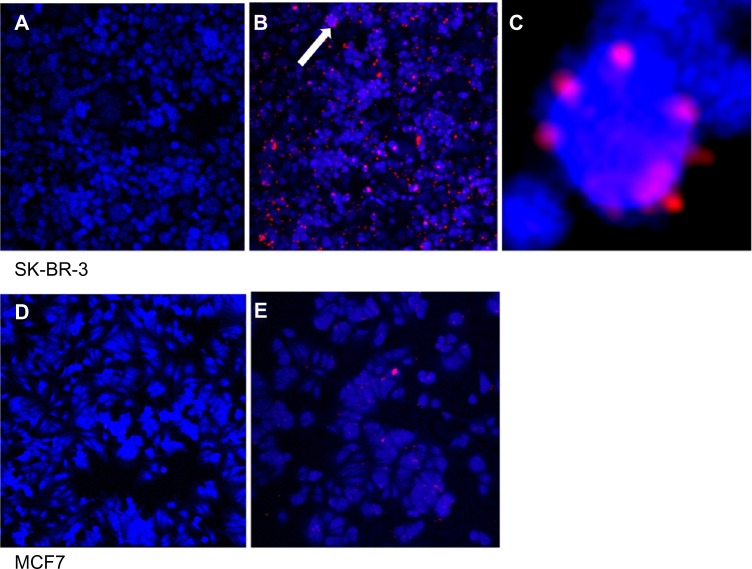
Fixed cell imaging of HER2 receptors in SK-BR-3 (A–C) and MCF7 (D and E) cell lines. (A) Control SK-BR-3 and (B) SK-BR-3 cells exposed to QD-anti-HER2-antibody. (C) Magnified inset of (B) showing ring-like fluorescence of QDs on the cell surface. (D) Control MCF7 and (E) MCF7 exposed to the QD-antiHER2-antibody bioconjugate.
Note: HER2-overexpressing cells show significantly higher fluorescence as the QD-antibody probe binds to the cell surface (B). Arrow demonstrates magnified inset of image B in image C. In contrast, MCF7 have lower expression of HER2 and show minimal fluorescence.
Abbreviations: HER2, human epidermal growth factor receptor 2; QDs, quantum dots.

