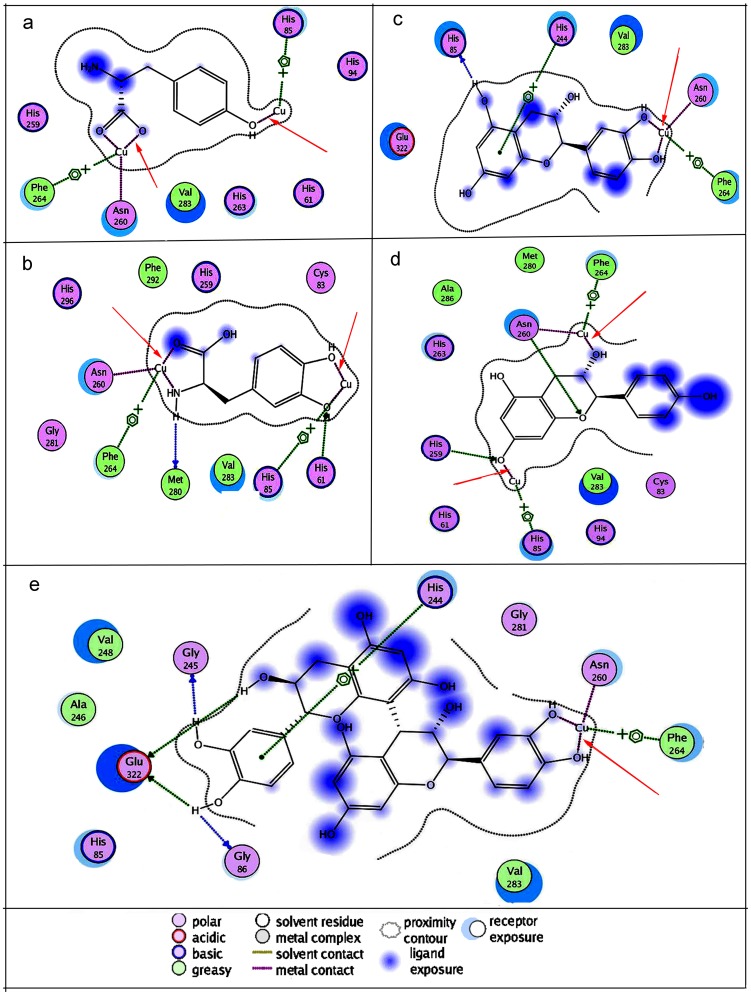
Figure 8. Binding mode of the lowest energy docked conformation found for the ligand with tyrosinase residues.
The receptor exposure differences were shown by the size and intensity of the turquoise discs surrounding the residues. The red arrows indicated the interaction of the ligand with the copper iron. a, b, c, d, and e represented L-Tyr, L-DOPA, catechin, afzelechin, and PCs dimmers, respectively.

