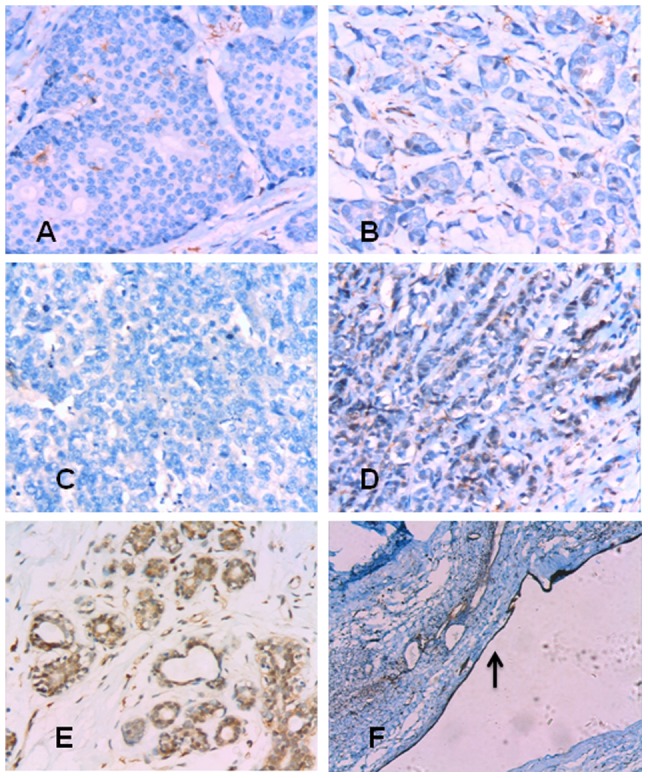
Figure 1. Expression of Dab2 in breast cancer specimens.

(A) Ductal carcinoma in situ with microinvasion showing underexpression of Dab2 (original magnification ×200). (B) Invasive ductal carcinoma showing underexpression of Dab2 (×200). (C) Invasive lobular carcinoma showing underexpression of Dab2 (×200). (D) Medullary carcinoma cells showing partial Dab2 positivity (cytoplasm; 2+) (×200). (E) Normal breast epithelial cells showing strong Dab2 positivity in the cytoplasm (×200). (F) Epithelial cells in a galactocele served as positive control (arrows indicate positive cells) (×50).
