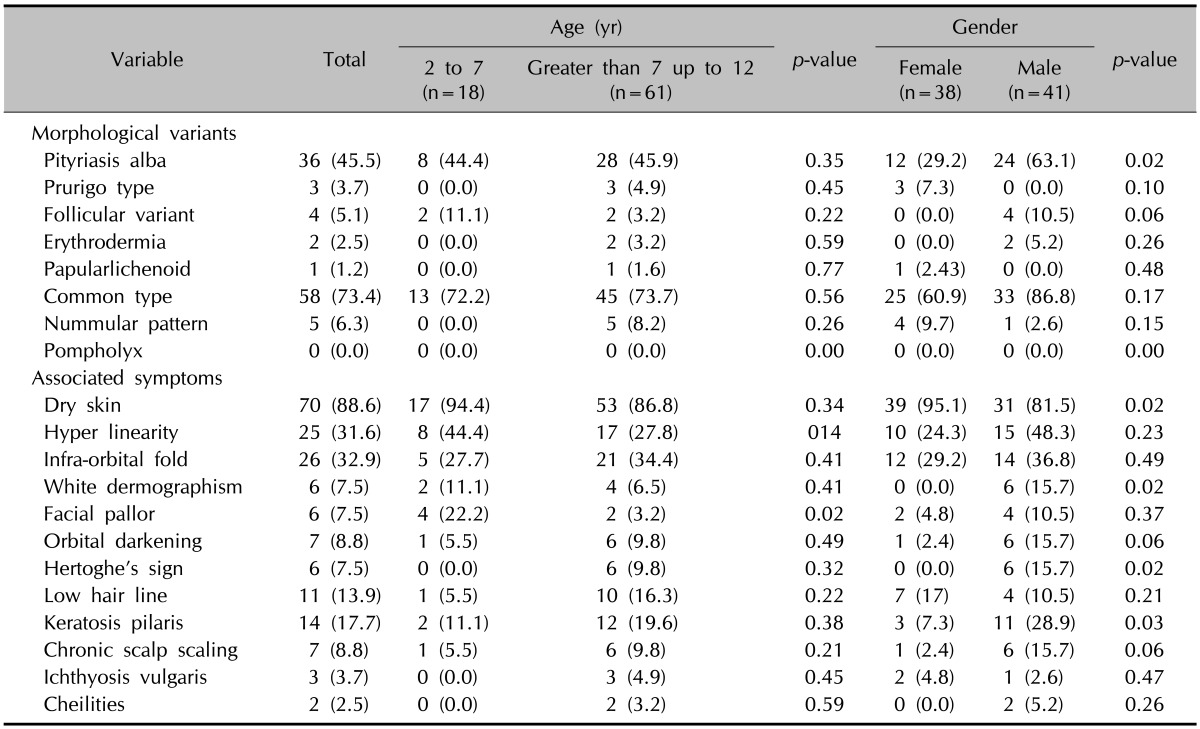
Table 5.
Distribution of morphological variants and frequency of associated symptoms categorized by age and gender

Values are presented as number (%).
Distribution of morphological variants and frequency of associated symptoms categorized by age and gender

Values are presented as number (%).