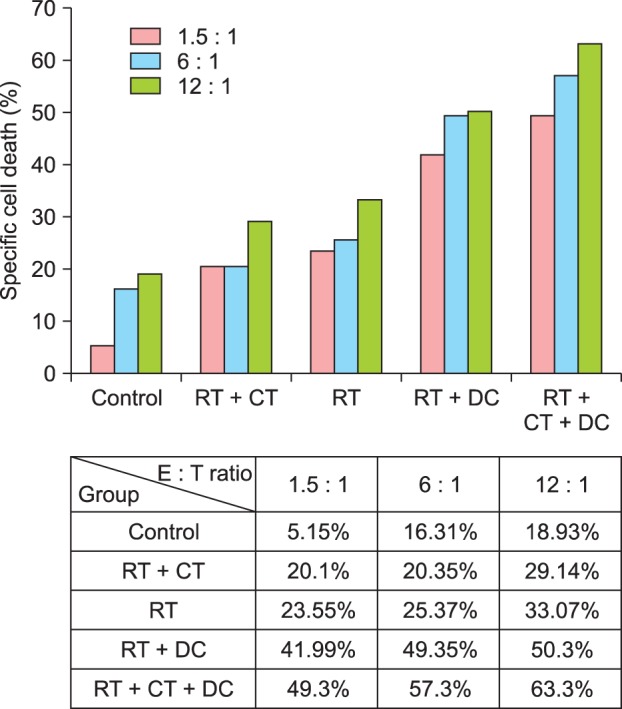
Fig. 6.

In vitro cytotoxicity assay with splenocytes from mice with complete tumor regression. The graph and table show the percentage of specific cell death at different E to T ratios in each experimental group. The PKH-26 flow cytometry evaluates MCA102 cells (T) after incubation with splenocytes after combination treatment (E). The PKH-26 assay results showed that the level of cytotoxicity was highest in the triple combination treatment group. T: target cells, E: effector cells, RT: radiotherapy, CT: chemotherapy, DC: dendritic cell.
