Fig. 2.

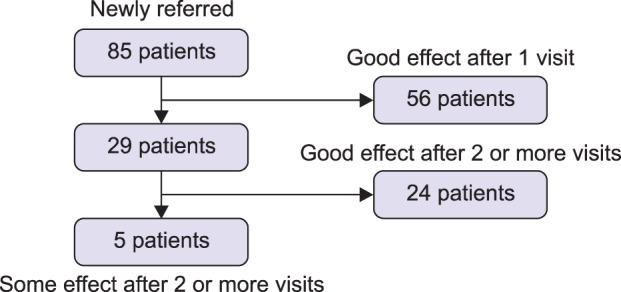
A flow chart of the patients registered in this study. The patients are subgrouped depending on the number of visits needed to obtain 'good effect'.

A flow chart of the patients registered in this study. The patients are subgrouped depending on the number of visits needed to obtain 'good effect'.