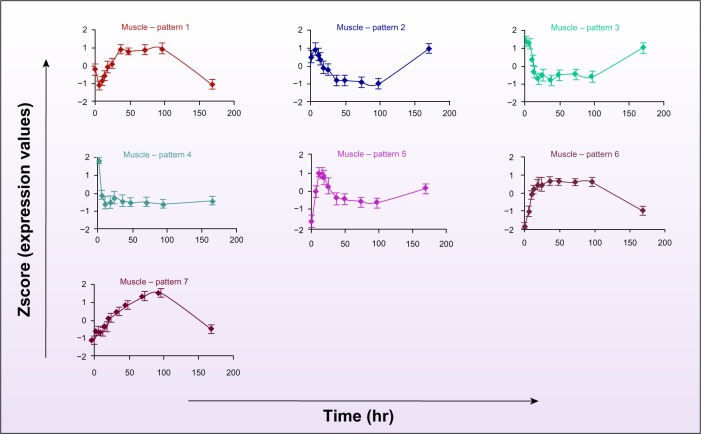
Figure 2.
Critical dynamic transcriptional responses in muscle under chronic corticosteroid administration. Each pattern is characterized by the average gene expression profile of the corresponding cluster of genes in the muscle dataset. The error bar shows the standard deviation of all probeset transcript levels at each time-point in each corresponding pattern.

