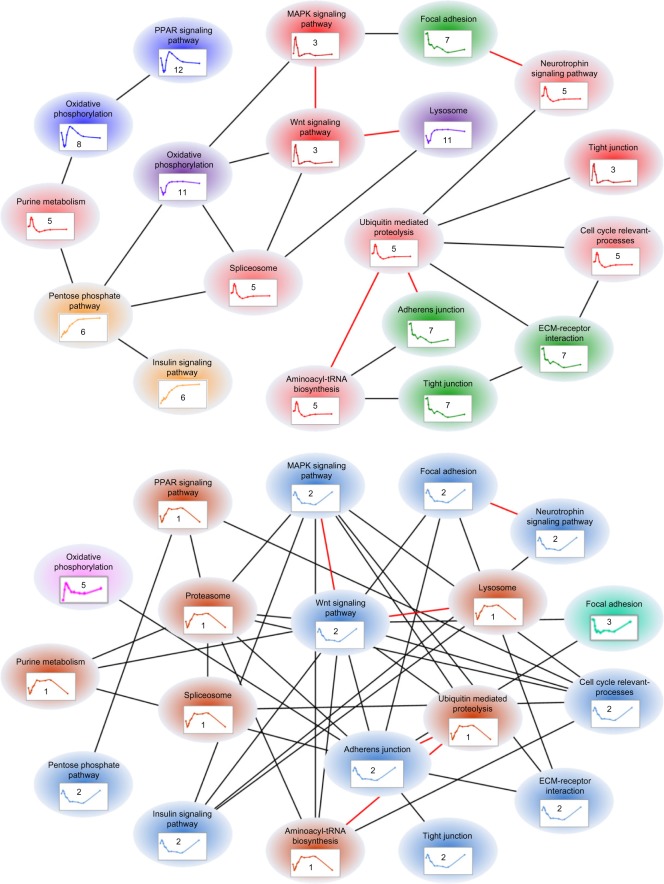
Figure 3.
Tissue-specific regulation represented by putative functional regulatory networks (top: liver; bottom: muscle). Each node represents a gene battery which is a set of coexpressed genes sharing a common function (pathway). Edges characterize the regulatory closeness between two gene batteries if the ratio of sharing common transcriptional regulators is greater than 0.8; ‘red’ edges express high regulatory closeness that occurs in both liver and muscle. Although these gene batteries are involved in similar functions under chronic corticosteroid administration, their expression patterns and transcriptional regulatory relationships are specific in liver vs. in muscle.

