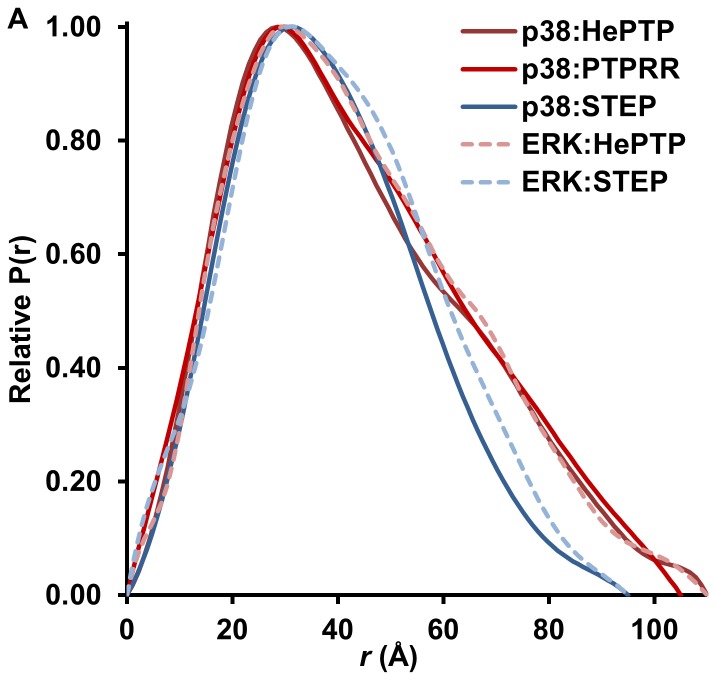
Figure 2. Comparison of the P(r) functions of the MAPK:KIM-PTP resting state complexes.
p38α:HePTP, maroon; p38α:PTPSL, red; p38α:STEP, dark blue; ERK2:HePTP, pink; ERK2:STEP, light blue (all p38α:KIM-PTP and ERK2:HePTP data were previously published [14], [15], [17], but are shown here to provide a better comparison of the P(r) functions).

