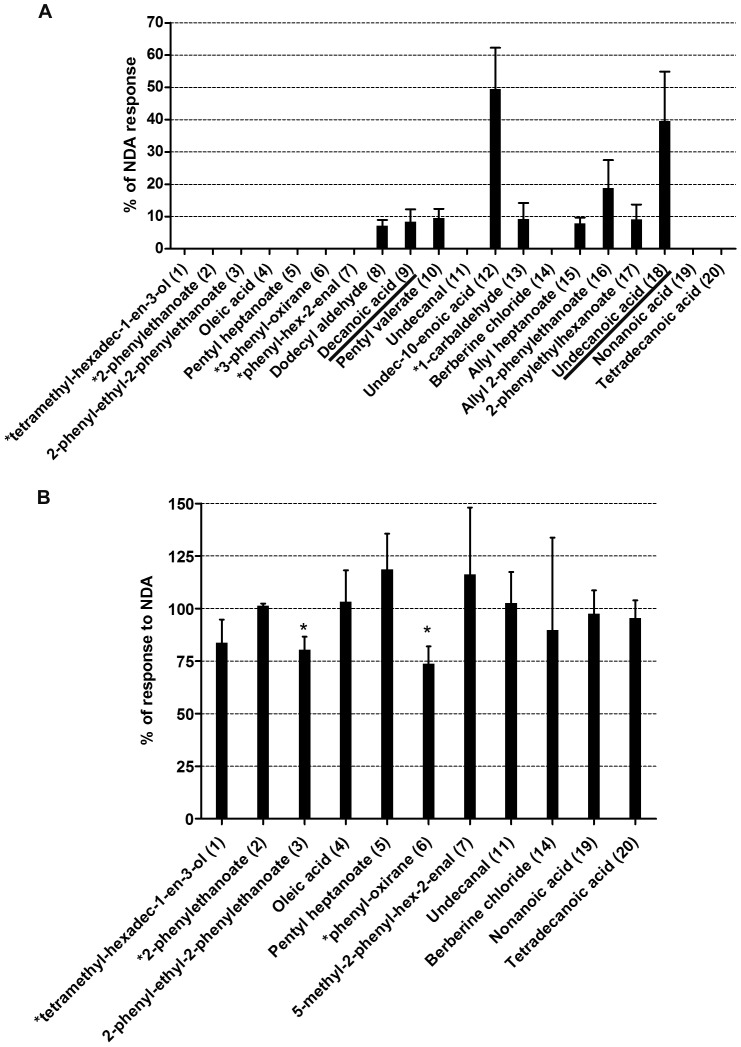
Figure 3. In vitro validation of in silico results.
A. Histogram showing relative activity of the top 20 candidate ligands listed according to their mfscore, tested at 100 μM and normalized to the nonanedioic acid, mean±SEM, n = 5–10. Full name of the compounds: Compound 1 = 3,7,11,15-tetramethyl-hexadec-1-en-3-ol (1); Compound 2 = 1-methyl-ethyl-2-phenylethanoate (2); Compound 6 = ethyl-3-methyl-3-phenyl-oxirane-2-carboylate (6); compound 7 = 5-methyl-2-phenyl-hex-2-enal (7) and compound 13 = 4-(4-hydroxy-4-methylpentyl)-cyclohexene-1-carbaldehyde (13). B. Histogram showing response of ligands tested as antagonists at 1mM concentration, in the presence of 10 μM NDA. Compounds 3 and 6 were identified as low potency antagonists, *p<0.0025. Previously identified ligands for MOR42-3 confirmed in our in silico screen are underlined.

