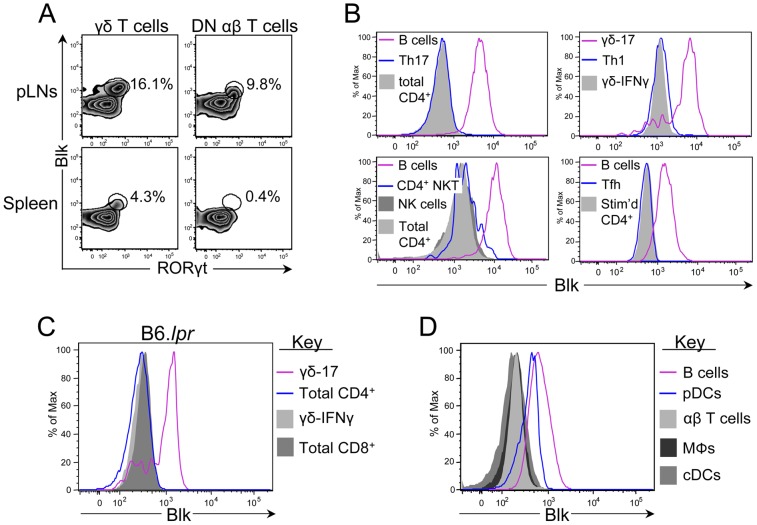
Figure 1. Comparison of Blk expression levels in multiple immune cell subsets.
(A) Dot plots showing RORγt versus Blk expression in gated γδ T cells (left) and DN αβ T cells (right) from the pLNs (top) and spleen (bottom) of B6 mice. (B) Histograms showing Blk expression levels in various effector cell subsets. Tfh and Th17 cells were obtained by culturing TCR-stimulated naïve CD4+ T cells under the respective polarizing conditions. The other effector subsets were identified by surface phenotype on ex vivo splenocytes or pLN cells from B6 mice. Specifically, they were NK cells (NK1.1+ CD3− CD19−), CD4+ NKT cells (CD4+ NK1.1+ TCRβ+ CD3+), and Th1 cells (CD4+ T-bet+). B cells (CD19+) and γδ-17 cells (CD27− CCR6+) are shown as positive controls. CD4+ TCRβ+ CD3+ cells, both ex vivo and in vitro TCR-stimulated, and γδ-IFNγ cells (CD27+ CCR6−) are shown as negative controls, as previously described [23]. (C) Histograms showing Blk expression levels in CD4+ TCRβ+ CD3+ and CD8+ TCRβ+ CD3+ pLN cells from B6.lpr mice displaying lymphadenopathy. γδ-17 and γδ-IFNγ cells from B6.lpr mice are shown as positive and negative controls, respectively. (D) Histograms showing Blk expression in B cells (CD19+; positive staining control), pDCs (CD19− CD317+ CD11c+), αβ T cells (CD3+; negative staining control), macrophages (MΦs; CD19− CD11b+), and cDCs (CD19− CD317− CD11c+) from the spleens of B6 mice. For all experiments, 4 to 8 mice per genotype were used.

